

SECTION 1
Historical Context & Motivation
The concept of endangered species — populations at serious risk of extinction — has existed informally for centuries, but it only entered the formal policy arena in the twentieth century as industrialization, habitat conversion, and overexploitation accelerated biodiversity loss at rates unprecedented in human history. Early naturalists such as John James Audubon and George Perkins Marsh documented alarming declines in North American wildlife, yet systematic legal protection did not emerge until the mid-1900s. The extinction of the passenger pigeon (Ectopistes migratorius) in 1914, a species that once darkened skies in flocks of billions, became a galvanizing symbol of how rapidly even abundant species can vanish when exploitation goes unchecked. That loss, combined with the near-extinction of the American bison, catalyzed a conservation ethic that would eventually crystallize into landmark legislation and international agreements.
1914 • Passenger Pigeon Extinction
1966 • Endangered Species Preservation Act
1973 • Endangered Species Act (ESA)
1975 • CITES Enters into Force
1992 • Convention on Biological Diversity
Despite these milestones, the rate of species endangerment has not slowed. The International Union for Conservation of Nature (IUCN) now lists more than 44,000 species as threatened with extinction. The central question for environmental scientists therefore remains: What are the primary drivers of endangerment, how do we quantify risk, and what strategies are most effective at preventing irreversible biodiversity loss?
SECTION 2
Core Principles & Definitions
Understanding endangered species requires a precise vocabulary. The IUCN Red List classification system assigns every assessed species to one of several categories based on quantitative criteria that include population size, rate of decline, geographic range, and probability of extinction within a defined timeframe. In U.S. policy, the Endangered Species Act distinguishes between endangered species (in danger of extinction throughout all or a significant portion of their range) and threatened species (likely to become endangered in the foreseeable future). Both designations trigger legal protections, but the distinction matters for management intensity and resource allocation.
Extinction
Background vs. Mass Extinction
Biodiversity Hotspots
Keystone & Indicator Species
Minimum Viable Population (MVP)
KEY TAKEAWAY
SECTION 3
Threats to Endangered Species — Visual Overview
The HIPPCO acronym is a staple of the AP Environmental Science curriculum because it encapsulates the interacting pressures that push species below viable population thresholds. It is critical to recognize that these threats rarely operate in isolation; for example, habitat fragmentation (H) may isolate a population, making it simultaneously more vulnerable to invasive predators (I) and less able to shift its range in response to climate change (C). This synergistic interaction — sometimes called an extinction vortex — means that small, isolated populations can spiral toward extinction even when no single threat alone would be lethal. Conservation biologists must therefore adopt multi-threat management frameworks that address the compounding nature of these pressures.
SECTION 4
How Species Become Endangered — The Extinction Vortex
The pathway from a stable population to extinction is rarely linear; instead, it typically follows a positive-feedback loop known as the extinction vortex. As a population declines, it becomes subject to intensifying genetic, demographic, and environmental stochasticity — random fluctuations that can push a small population to zero even if the original stressor is removed. For instance, a small population may experience inbreeding depression, where reduced genetic diversity lowers fitness, which further reduces population size, which further reduces genetic diversity. Understanding this feedback loop is essential because it explains why early intervention is far more cost-effective than last-ditch efforts to save critically endangered species.
SPECIES-AREA RELATIONSHIP
Where S = number of species in the area, A = area of habitat, c = a taxon- and region-specific constant, and z = a constant describing the slope of the species-area curve (typically 0.15–0.35 for islands, ~0.1–0.2 for mainland habitat fragments). This power-law relationship, derived from island biogeography theory, predicts that a 90% reduction in habitat area leads to a loss of roughly 50% of species (when z ≈ 0.3).
POPULATION VIABILITY — RULE OF THUMB
The 50/500 rule is a widely cited guideline in conservation genetics: a minimum effective population size of 50 individuals is needed to avoid short-term inbreeding depression, while 500 individuals are required to maintain long-term evolutionary potential. Recent research suggests these thresholds may need to be revised upward (100/1,000), but the concept remains central to population viability analysis (PVA).
LAMBDA — POPULATION GROWTH RATE
Where λ (lambda) is the finite rate of population change. If λ < 1, the population is declining; if λ > 1, it is increasing; if λ = 1, it is stable. Conservation managers use population viability analysis (PVA) models to project lambda over decades and estimate extinction probabilities under different management scenarios.
KEY TAKEAWAY
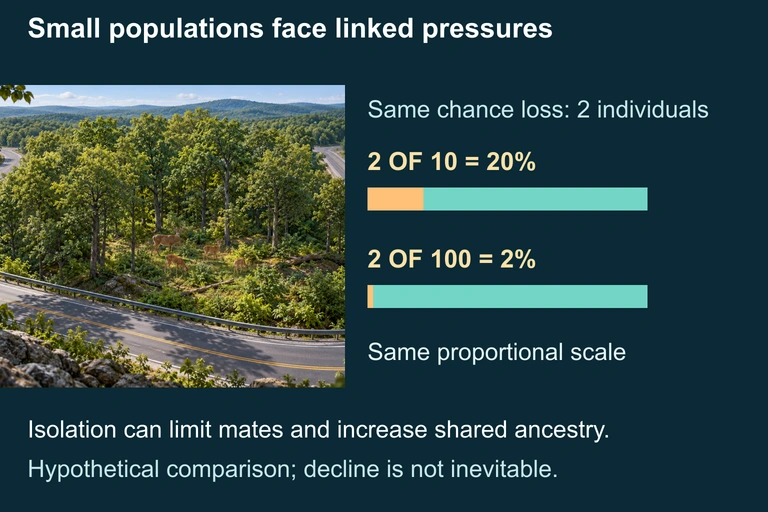 Small isolated populations can experience linked demographic and genetic pressures. The same chance loss represents a larger fraction of a small population.
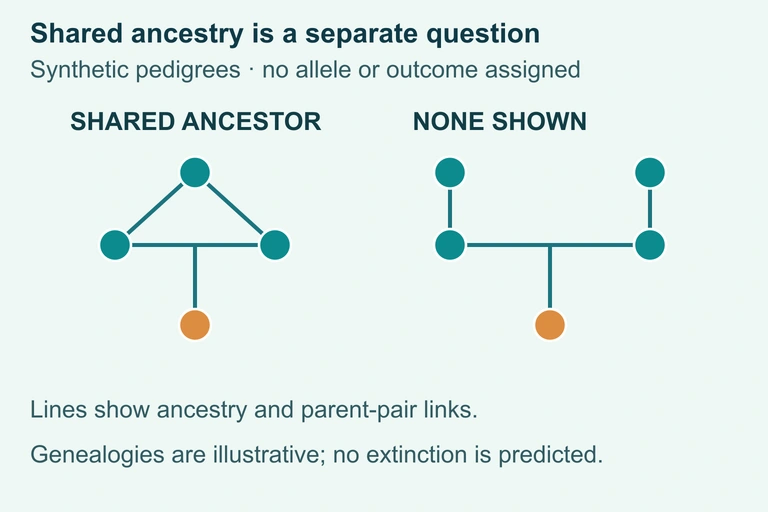 A shared shown ancestor is evidence of relatedness; no shared ancestor shown is not proof of unrelatedness.
SECTION 5
IUCN Red List Categories & Conservation Strategies
The IUCN Red List of Threatened Species is the world's most comprehensive inventory of the conservation status of biological species. It evaluates species against five quantitative criteria (population size reduction, geographic range, small population size and decline, very small or restricted population, and quantitative extinction risk analysis) and assigns each to one of nine categories. For the AP exam, the most important categories are the three that collectively constitute 'threatened': Vulnerable (VU), Endangered (EN), and Critically Endangered (CR).
On the AP exam, you should be prepared to distinguish between in-situ conservation (protecting species in their natural habitat through national parks, wildlife refuges, and habitat corridors) and ex-situ conservation (maintaining populations outside their natural habitat in zoos, botanical gardens, and seed banks). Neither approach alone is sufficient; modern conservation biology increasingly integrates both within adaptive management frameworks that respond to monitoring data. The California condor recovery program exemplifies this integration — captive breeding brought the population from 22 individuals in 1987 to over 500 today, but ongoing in-situ management (lead-ammunition bans, nest-site protection) remains essential for long-term viability.
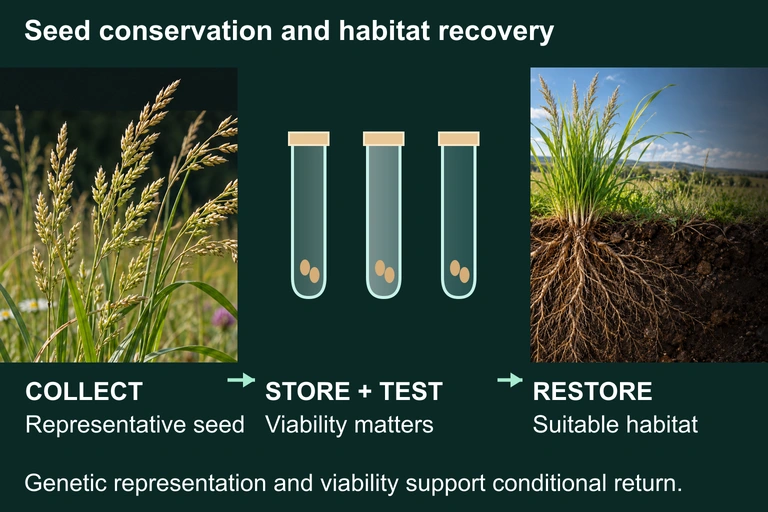 Seed banking can preserve representative material outside its habitat. Viability testing, genetic representation and a suitable restored site remain separate requirements for a possible return. Storage conditions depend on the species. The generic images do not depict a named species.
SECTION 6
Worked Example — Species-Area Relationship
A tropical forest island originally had 10,000 km² of intact habitat supporting an estimated 500 species of birds. Logging reduces the forest to 1,000 km². Using the species-area relationship (S = cAz) with z = 0.30, estimate how many bird species the island can support after habitat loss, and how many species are predicted to go extinct.
Predicting Species Loss from Habitat Reduction
- 1
Step 1 — Identify Given Values
Original area A₁ = 10,000 km²; Reduced area A₂ = 1,000 km²; Original species S₁ = 500; z = 0.30. We need to find S₂ (species after habitat loss) and the number of predicted extinctions (S₁ − S₂). - 2
Step 2 — Set Up the Species-Area Ratio
Because S = cAz, we can write the ratio S₂/S₁ = (A₂/A₁)z. The constant c cancels, which is convenient because we rarely know it precisely. - 3
Step 3 — Calculate the Area Ratio
A₂/A₁ = 1,000 / 10,000 = 0.10. The habitat has been reduced to 10% of its original area.Area ratio = 0.10 - 4
Step 4 — Raise to the Power z
(A₂/A₁)z = (0.10)0.30. Using a calculator: 0.100.30 = 10−0.30 ≈ 0.501.Species ratio ≈ 0.501 - 5
Step 5 — Calculate S₂ and Predicted Extinctions
S₂ = S₁ × 0.501 = 500 × 0.501 ≈ 250 species. Predicted extinctions = S₁ − S₂ = 500 − 250 = 250 species. A 90% reduction in habitat area is predicted to cause the loss of approximately 50% of bird species.S₂ ≈ 250 species; ~250 species lost (50%)
AP Exam Tip
SECTION 7
Strengths & Limitations of Conservation Approaches
| Strategy | Strengths | Limitations |
|---|---|---|
| Protected Areas (In-Situ) | Preserves entire ecosystems and ecological interactions; protects co-occurring species; maintains evolutionary processes in natural habitats | Requires large land areas; political vulnerability to boundary changes; may displace indigenous communities; difficult to enforce in developing nations; 'paper parks' provide legal but not actual protection |
| Wildlife Corridors | Connects fragmented habitats; allows gene flow and range shifts under climate change; reduces edge effects of isolated reserves | Expensive to establish through developed land; may facilitate spread of invasive species or disease; effectiveness varies by taxon and landscape context |
| Captive Breeding (Ex-Situ) | Can rescue species at extremely low population sizes; produces individuals for reintroduction; maintains genetic material in gene banks | Very costly per individual; behavioral and genetic adaptation to captivity; limited space means only a fraction of endangered species can be maintained; does not address root causes of decline |
| Legislation (ESA, CITES) | Provides legal teeth for enforcement; mandates recovery plans; ESA has prevented extinction of 99% of listed species; CITES curbs international wildlife trade | Listing process is slow and politically contentious; species must already be in decline to qualify; compliance varies internationally; enforcement resources often inadequate |
| Community-Based Conservation | Engages local stakeholders; integrates traditional ecological knowledge; sustainable because it aligns conservation with economic incentives (ecotourism, sustainable harvest) | Requires long-term funding and institutional support; may conflict with national policies; success depends on local governance capacity and equitable benefit-sharing |
Comparison of major conservation strategies for endangered species
KEY TAKEAWAY
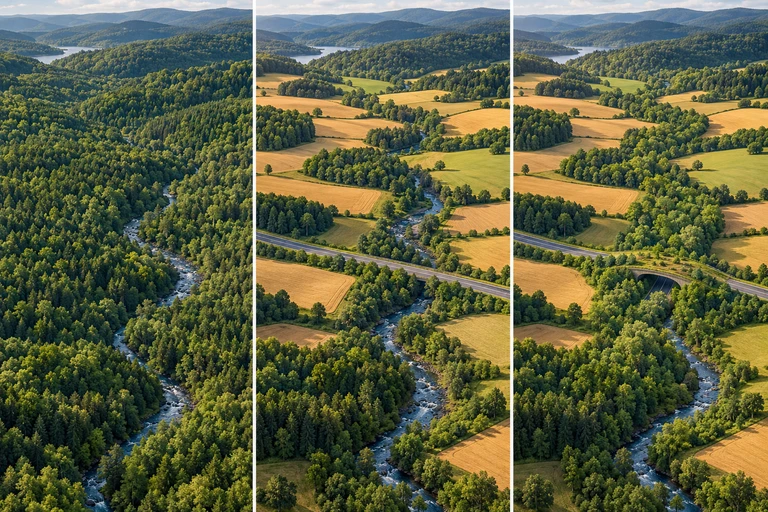 A habitat corridor can permit movement between patches. Gene flow additionally requires migrants to reproduce successfully in the receiving population.
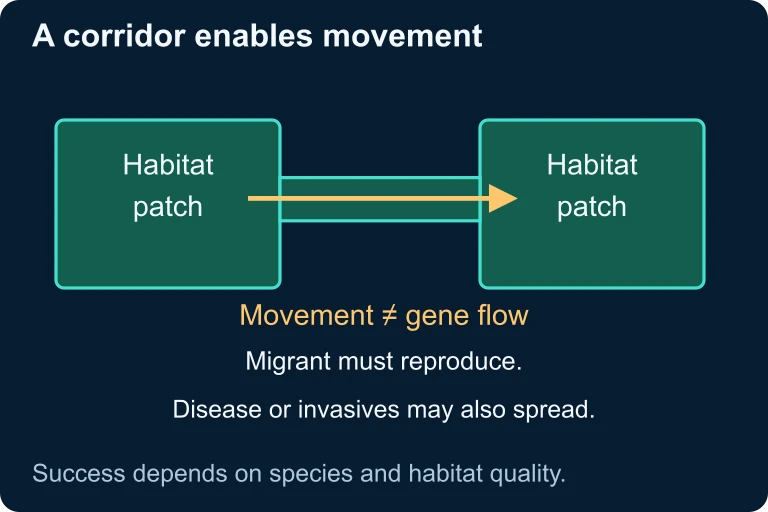 A habitat corridor can permit movement between patches. Gene flow additionally requires migrants to reproduce successfully in the receiving population.
SECTION 8
Connections to Ecosystem Services & Global Policy
The protection of endangered species is not merely a moral or aesthetic concern — it has profound implications for the ecosystem services upon which human economies and well-being depend. Species contribute to provisioning services (food, medicine, genetic resources), regulating services (pollination, pest control, water purification), cultural services (recreation, spiritual value), and supporting services (nutrient cycling, soil formation). The loss of even a single keystone or functionally unique species can trigger trophic cascades that restructure entire ecosystems — the reintroduction of wolves to Yellowstone National Park famously demonstrated how a top predator altered elk behavior, which in turn allowed riparian vegetation to recover, stabilizing stream banks and increasing biodiversity across multiple trophic levels.
| Dimension | Species-Level Focus | Ecosystem-Level / Global Focus |
|---|---|---|
| Unit of Conservation | Individual species populations; genetic diversity within species | Entire biomes, landscapes, and ecological processes; functional diversity across trophic levels |
| Primary Metric | Population size, lambda (λ), IUCN status, genetic heterozygosity | Species richness, ecosystem service valuation, habitat area protected, carbon storage |
| Key Policy | Endangered Species Act, CITES, species-specific recovery plans | Convention on Biological Diversity, 30×30 targets (Kunming-Montreal Global Biodiversity Framework), REDD+ |
| Limitation | Can be expensive per species; 'charismatic megafauna' bias; may ignore less visible but ecologically critical species | May overlook species-specific needs; relies on political will for large-scale land-use changes; harder to measure success |
Species-level vs. ecosystem-level conservation approaches
Looking forward, the Kunming-Montreal Global Biodiversity Framework (adopted in December 2022) represents the latest global effort, setting a target to protect 30% of Earth's land and ocean by 2030 (the '30×30' goal). This framework signals a shift from species-by-species rescue toward landscape-scale habitat preservation — an approach that, if adequately funded and enforced, could provide a far more cost-effective safety net for endangered species by maintaining the ecological contexts in which they evolved. Nonetheless, individual species protections under the ESA and CITES remain essential for the most imperiled taxa, and the AP exam expects you to evaluate both scales of intervention critically.
SECTION 9
Practice Problems
Question 1: CONCEPTUAL
- A. Increased gene flow from a neighboring population
- B. Inbreeding depression resulting from small population size
- C. Directional selection favoring disease-resistant alleles
- D. Density-dependent regulation at carrying capacity
Show answer (B)
Question 2: BASIC CALCULATION
- A. 20 species
- B. 80 species
- C. 100 species
- D. 160 species
Show answer (C)
Question 3: INTERMEDIATE
- A. A private landowner plants a native garden to attract butterflies
- B. A federal highway project is proposed through designated critical habitat for the Florida panther
- C. A state park agency introduces interpretive signage about local endangered plants
- D. A university research team publishes a study on the genetics of an endangered bird
Show answer (B)
Question 4: APPLIED
4 ptsShow answer
Question 5: CRITICAL THINKING
4 ptsShow answer
SUMMARY
Endangered Species — Key Concepts Review
Summary
Endangered species are populations at serious risk of extinction, classified by the IUCN Red List into categories ranging from Least Concern to Critically Endangered. The six major anthropogenic threats are organized by the HIPPCO framework: Habitat loss (the dominant driver), Invasive species, Population growth, Pollution, Climate change, and Overexploitation. These threats interact synergistically through the extinction vortex, a positive-feedback loop in which declining population size leads to reduced genetic diversity, lower fitness, and further decline.
Conservation strategies include in-situ approaches (protected areas, wildlife corridors, habitat restoration) and ex-situ approaches (captive breeding, seed banks), reinforced by legal frameworks such as the Endangered Species Act and CITES. The species-area relationship (S = cAz) allows quantitative prediction of species loss from habitat reduction and is a key equation for the AP exam. The 50/500 rule provides guidance on minimum viable population sizes needed to avoid inbreeding depression and maintain long-term evolutionary potential. Modern global efforts, exemplified by the Kunming-Montreal 30×30 target, aim to scale conservation from species-level rescue to landscape-level ecosystem preservation.