

SECTION 1
Historical Context & Discovery
For centuries, Peruvian fishermen noticed that some years the normally cold, nutrient-rich waters off the South American coast turned unusually warm around Christmastime, decimating their anchovy catches. They called this phenomenon El Niño—"the Christ Child"—because of its timing near the holiday season. What began as local fishing lore eventually became one of the most consequential discoveries in climate science: a coupled ocean-atmosphere oscillation that drives weather variability across the entire planet.
1890s • Peruvian Fishermen Document Warm Events
1924 • Walker Identifies the Southern Oscillation
1969 • Bjerknes Links Ocean and Atmosphere
1997–1998 • "Super El Niño" Validates Forecasting
2015–2016 • Modern Monitoring and Climate Interactions
The central question ENSO research addresses is deceptively simple: why does the tropical Pacific periodically oscillate between warm (El Niño) and cool (La Niña) states, and how do these shifts propagate through atmospheric teleconnections to affect precipitation, temperature, and ecological systems thousands of kilometers away? Understanding this cycle is essential for the AP Environmental Science exam, where ENSO appears in topics ranging from ocean circulation and weather patterns to biodiversity loss and food security.
SECTION 2
Core Principles of ENSO
The El Niño–Southern Oscillation (ENSO) is a quasi-periodic climate pattern arising from the interaction between the tropical Pacific Ocean and the overlying atmosphere. It cycles between three phases—El Niño (warm), La Niña (cool), and neutral—on an irregular timescale of roughly two to seven years. The following foundational ideas explain the mechanism.
Trade Winds & Walker Circulation
Thermocline Tilt & Upwelling
Bjerknes Positive Feedback
Southern Oscillation Index (SOI)
Teleconnections
KEY TAKEAWAY
SECTION 3
Visual Explanation: Normal vs. El Niño vs. La Niña
Notice how the thermocline's shape is the key variable linking the ocean and the atmosphere. A flattened thermocline during El Niño suppresses upwelling, cutting off the nutrient supply that sustains phytoplankton, which cascades through marine food webs and devastates fisheries. Conversely, a steeply tilted thermocline during La Niña enhances biological productivity off the South American coast but can produce drought in the western Americas and intensified monsoons in Southeast Asia. The Walker Circulation shifts accordingly: during El Niño, the rising branch of this zonal cell migrates from the western to the central Pacific, redistributing convective rainfall and altering jet stream trajectories.
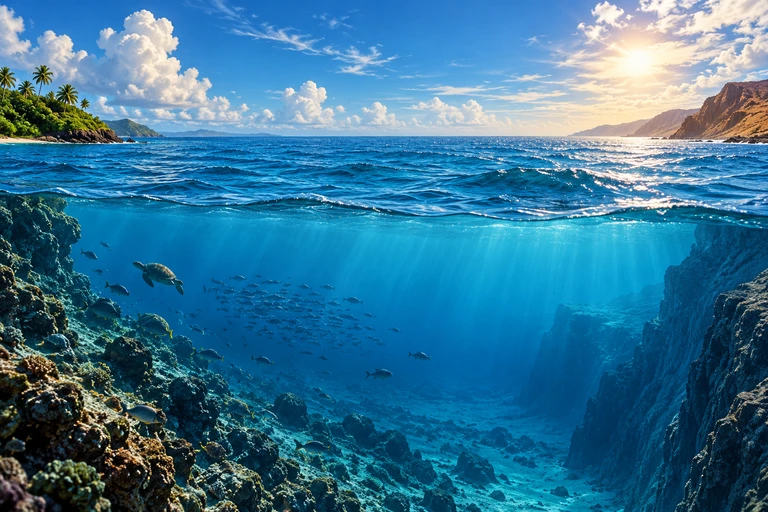 Trade winds reorganize warm surface water and the thermocline, changing the supply of cold water to the eastern Pacific surface.
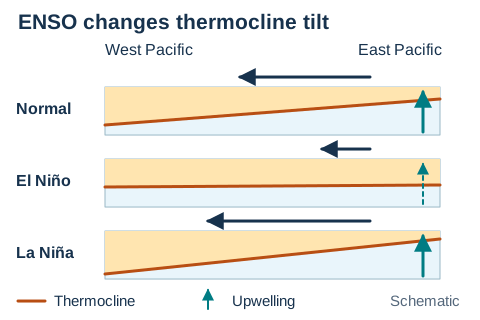 Typical trade winds drive surface water westward, leaving the thermocline deeper in the west and shallower in the east. Weaker winds during El Niño flatten this contrast and reduce eastern upwelling; stronger La Niña winds strengthen the contrast and eastern upwelling.Open full diagram
SECTION 4
The ENSO Mechanism in Detail
Bjerknes Feedback Loop
The core mechanism of ENSO rests on the Bjerknes positive feedback. Suppose a random perturbation weakens the easterly trade winds slightly. This reduces the westward push on surface water, allowing the warm pool to expand eastward. The resulting increase in SSTs in the central Pacific lowers surface pressure there, further weakening the pressure gradient that drives the trade winds. Each component reinforces the other, amplifying a small anomaly into a basin-wide El Niño event over a period of months.
Delayed Oscillator Theory
If positive feedback were the only process, ENSO would simply lock into one phase permanently. The delayed oscillator theory explains the phase transitions. During an El Niño, equatorial Kelvin waves (downwelling) propagate eastward, deepening the thermocline. Simultaneously, off-equatorial Rossby waves (upwelling) propagate westward, reflect off the western boundary, and return to the equator as upwelling Kelvin waves. These reflected waves arrive months later, shoaling the thermocline and terminating El Niño—often initiating a La Niña in the process.
SOUTHERN OSCILLATION INDEX
P = standardized mean sea-level pressure anomaly; σ = standard deviation of the long-term monthly pressure difference. SOI < −7 sustained ≈ El Niño; SOI > +7 sustained ≈ La Niña.
OCEANIC NIÑO INDEX (ONI)
El Niño: ONI ≥ +0.5 °C for 5 consecutive overlapping 3-month periods. La Niña: ONI ≤ −0.5 °C for 5 consecutive overlapping 3-month periods. The ONI is NOAA's primary operational index for ENSO classification.
AP Exam Tip
SECTION 5
Global Environmental & Ecological Impacts
ENSO's effects extend far beyond the tropical Pacific through atmospheric teleconnections—large-scale patterns in which tropical heating anomalies alter jet stream position and Hadley cell intensity, propagating weather shifts to mid-latitude and even polar regions.
| Impact Category | El Niño Effects | La Niña Effects |
|---|---|---|
| Pacific Fisheries | Suppressed upwelling → nutrient decline → anchovy/sardine crash | Enhanced upwelling → nutrient surge → increased fish productivity |
| Coral Reefs | Elevated SSTs → mass bleaching (zooxanthellae expulsion) | Cooler SSTs → recovery period, reduced bleaching risk |
| Atlantic Hurricanes | Increased wind shear → fewer, weaker hurricanes | Reduced wind shear → more active hurricane seasons |
| Global Temperature | Releases heat to atmosphere → global mean temp rises ~0.1–0.2 °C | Absorbs heat in ocean → global mean temp dips slightly |
| Agriculture | Drought in SE Asia reduces rice yields; flooding damages crops in South America | Drought in southern US reduces corn/soy yields; improved monsoons in Asia |
Comparison of major environmental and economic impacts of El Niño vs. La Niña
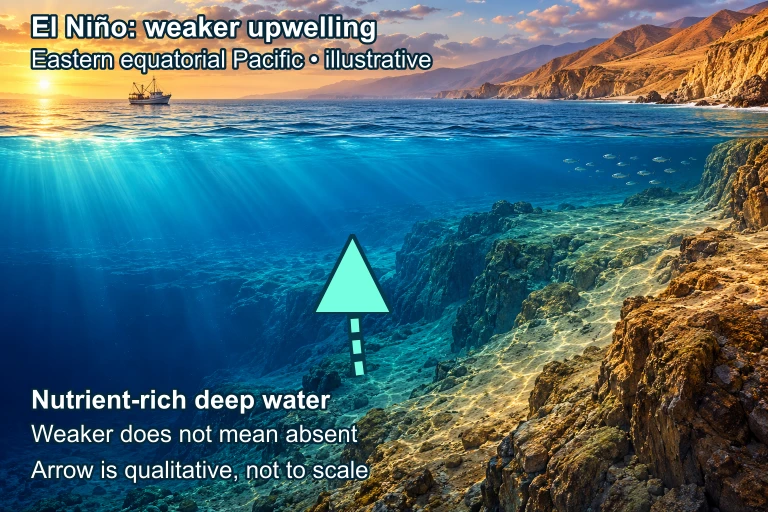 During the selected El Niño scenario, nutrient-rich upwelling in the eastern equatorial Pacific can weaken without stopping. Fishery and rainfall responses vary by region and season. The scene and arrow are qualitative, not measurements.
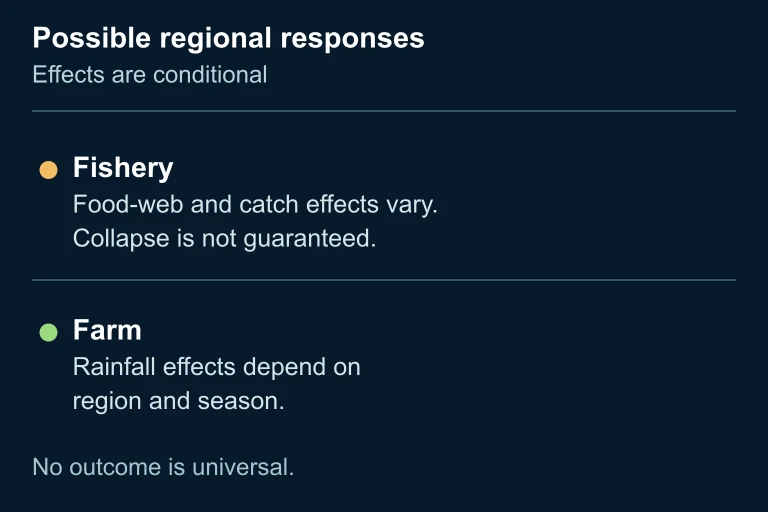 Fishery food webs and catches can respond to weaker nutrient supply; rainfall effects on farms vary with region and season. Collapse is not inevitable.
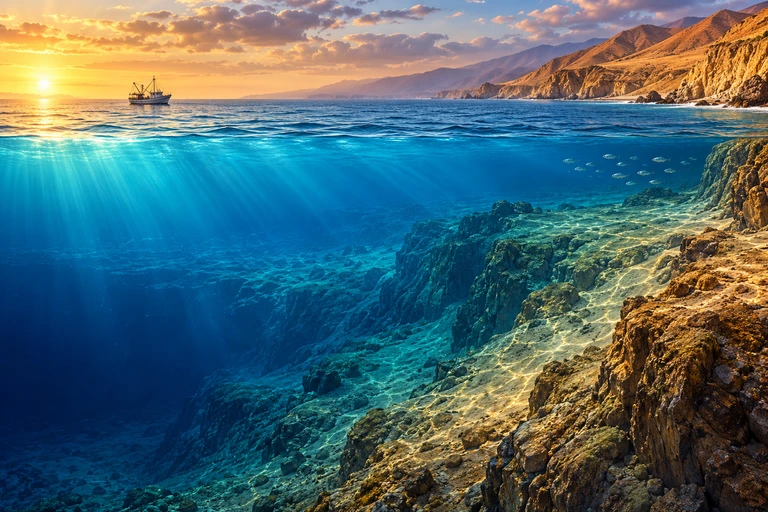 Illustrative coastal context; use the adjacent upwelling and regional-effects panels for the mechanism.
SECTION 6
Worked Example: Interpreting ENSO Data
On the AP Environmental Science exam, you may be given sea-surface temperature anomaly data, SOI values, or descriptions of regional weather patterns and asked to identify the ENSO phase and predict environmental consequences. Let's walk through a representative scenario.
Identifying ENSO Phase from SST Anomaly Data
- 1
Step 1 — Read the Data
A table shows Niño 3.4 region SST anomalies for Oct–Dec (+1.1 °C), Nov–Jan (+1.4 °C), Dec–Feb (+1.6 °C), Jan–Mar (+1.5 °C), and Feb–Apr (+1.3 °C). All values exceed +0.5 °C for five consecutive overlapping 3-month periods.ONI consistently ≥ +0.5 °C - 2
Step 2 — Apply the ONI Threshold
NOAA defines El Niño as five consecutive overlapping 3-month periods where the ONI is at or above +0.5 °C. Since all five periods exceed this threshold—and the peak reaches +1.6 °C, placing it in the "strong" category (≥ +1.5 °C)—this qualifies as a strong El Niño event.Classification: Strong El Niño - 3
Step 3 — Predict Regional Impacts
Based on known teleconnections for strong El Niño: (1) Increased winter precipitation along the US West Coast, especially southern California, due to a southward-displaced jet stream. (2) Drought in Indonesia and eastern Australia from a weakened or reversed Walker Circulation. (3) Elevated coral bleaching risk across the central Pacific. (4) Reduced Atlantic hurricane activity due to increased vertical wind shear.Multiple testable predictions follow from the ENSO phase - 4
Step 4 — Connect to Broader Environmental Themes
A strong El Niño temporarily raises global mean surface temperature by approximately 0.1–0.2 °C because the ocean releases stored heat to the atmosphere. This can mask or amplify long-term anthropogenic warming trends, which is why climate scientists remove ENSO signals when analyzing decadal temperature records.ENSO modulates—but does not cause—long-term climate trends
SECTION 7
El Niño vs. La Niña: A Comparative Framework
| Feature | El Niño | La Niña |
|---|---|---|
| SST Anomaly (Niño 3.4) | ≥ +0.5 °C (warm) | ≤ −0.5 °C (cool) |
| Trade Winds | Weakened or reversed | Strengthened |
| Thermocline (Eastern Pacific) | Deeper → suppressed upwelling | Shallower → enhanced upwelling |
| Walker Circulation | Weakened; convection shifts to central Pacific | Strengthened; enhanced convection over western Pacific |
| SOI | Negative (lower pressure at Tahiti) | Positive (higher pressure at Tahiti) |
| Global Temp Effect | Slight warming (~0.1–0.2 °C) | Slight cooling |
| Typical Duration | 9–12 months | 9–12 months (can persist 2–3 years) |
Side-by-side comparison of El Niño and La Niña characteristics
KEY TAKEAWAY
SECTION 8
ENSO and Anthropogenic Climate Change
One of the most actively researched questions in climate science is how anthropogenic global warming will alter ENSO behavior. Climate models suggest several possibilities: more frequent extreme El Niño events, a shift in the spatial pattern of warming toward the central Pacific ("Modoki" El Niño), and increased precipitation variability during both phases. However, there is substantial model disagreement, and the observational record is too short to draw definitive statistical conclusions about long-term ENSO trends.
| Aspect | Natural ENSO Variability | Projected Under Climate Change |
|---|---|---|
| Frequency | Irregular, 2–7 year cycle | Possibly more frequent extreme events |
| Intensity | Variable; super events (1997–98, 2015–16) | Strong El Niño events may double in frequency by 2100 |
| Precipitation impacts | Significant but bounded by historical range | Warmer atmosphere holds more moisture → amplified floods/droughts |
| Coral reef vulnerability | Recovery between events | Higher baseline SSTs → bleaching during neutral years; El Niño pushes past lethal thresholds |
How climate change may modify ENSO dynamics
For the AP exam, the critical link to remember is that ENSO represents natural climate variability superimposed on the long-term anthropogenic warming trend. A strong El Niño year (like 2015–16) may set global temperature records not because El Niño alone causes warming, but because the temporary ENSO warming adds to the background signal of greenhouse-gas-driven climate change. Conversely, La Niña years may temporarily slow the apparent rate of warming, sometimes misleadingly cited as evidence against climate change. Distinguishing between natural oscillations and forced trends is a fundamental skill in environmental science.
SECTION 9
Practice Problems
Question 1: CONCEPTUAL
- A. Trade winds weaken, allowing warm water to spread eastward
- B. The thermocline deepens uniformly across the basin
- C. Stronger trade winds enhance upwelling of cold, nutrient-rich water off South America
- D. Upwelling decreases along the equatorial eastern Pacific
Show answer (C)
Question 2: BASIC CALCULATION
- A. Moderate El Niño, because no value exceeds +1.5 °C for more than one period
- B. Strong El Niño, because the peak ONI reaches +1.5 °C and all values exceed +0.5 °C for five consecutive periods
- C. Strong La Niña, because the anomaly exceeds the ±0.5 °C threshold
- D. Neutral ENSO conditions, because the values fluctuate
Show answer (B)
Question 3: INTERMEDIATE
- A. El Niño conditions are suppressing upwelling and raising sea-surface temperatures across the equatorial Pacific
- B. La Niña conditions are intensifying upwelling and cooling the central Pacific
- C. Ocean acidification from elevated CO₂ is reducing phytoplankton calcification and weakening coral skeletons
- D. Coastal pollution runoff is creating dead zones and smothering coral reefs
Show answer (A)
Question 4: APPLIED
4 ptsShow answer
Question 5: CRITICAL THINKING
4 ptsShow answer
SUMMARY
Lesson Summary
Summary
The El Niño–Southern Oscillation (ENSO) is a coupled ocean-atmosphere cycle in the tropical Pacific that alternates between El Niño (warm phase) and La Niña (cool phase) on an irregular 2–7 year timescale. The mechanism is driven by the Bjerknes positive feedback between trade wind strength, sea-surface temperatures, and thermocline depth. Phase transitions are governed by oceanic Kelvin and Rossby waves that act as delayed negative feedback.
ENSO drives global teleconnections that reshape precipitation, temperature, hurricane activity, marine productivity, and coral reef health worldwide. The Southern Oscillation Index (SOI) and Oceanic Niño Index (ONI) are the primary tools for classifying ENSO phases. Critically, ENSO represents natural climate variability superimposed on the long-term trend of anthropogenic warming—the two interact, amplifying impacts like coral bleaching and extreme weather, but ENSO does not drive the sustained warming trend.