

SECTION 1
Historical Context & Motivation
For most of human history, the benefits that nature provided—clean water, fertile soil, pollination of crops, and regulation of climate—were taken for granted as inexhaustible resources. It was not until the latter half of the twentieth century that ecologists and economists began to articulate a formal framework for understanding these benefits as ecosystem services, the direct and indirect contributions of ecosystems to human well-being. The concept arose in response to mounting evidence that biodiversity loss and habitat degradation were undermining the very natural systems on which agriculture, public health, and economic stability depend. By framing nature's contributions in terms that policymakers and economists could engage with, researchers hoped to make the case that conservation is not merely an aesthetic or ethical pursuit but a practical necessity.
1970 • Study of Critical Environmental Problems (SCEP)
1997 • Costanza's Global Valuation
2001 • Millennium Ecosystem Assessment Launched
2005 • MEA Report Released
2012 • IPBES Established
The central question that ecosystem services research addresses is deceptively simple: What would it cost humanity if natural systems ceased to function? By assigning measurable value—whether monetary, ecological, or social—to the processes that sustain clean air, drinkable water, productive soils, and stable climates, scientists create a common language through which conservation priorities can be communicated to governments, corporations, and communities. This framework underpins much of AP Environmental Science, linking biodiversity to tangible human outcomes.
SECTION 2
Core Principles & Definitions
The Millennium Ecosystem Assessment established a classification system that divides ecosystem services into four broad categories. Understanding these categories and their interdependencies is essential for the APES exam, as questions frequently require students to identify the category to which a given service belongs and to explain why the loss of one service can cascade through others. The four categories—provisioning, regulating, cultural, and supporting—are not isolated; supporting services (such as nutrient cycling) are the foundation upon which provisioning, regulating, and cultural services ultimately rest.
Provisioning Services
Regulating Services
Cultural Services
Supporting Services
KEY TAKEAWAY
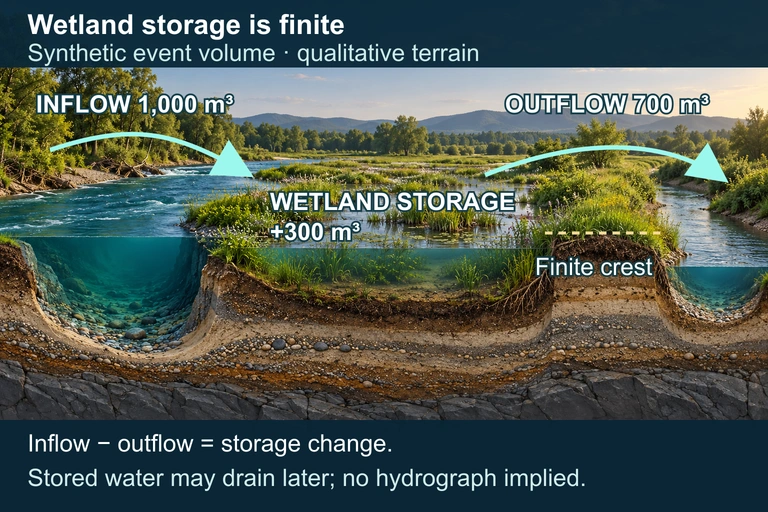 A wetland can temporarily store floodwater and reduce downstream peaks. Storage is finite, and water can later return through outlets or overflow.
SECTION 3
Visual Explanation: The Ecosystem Services Framework
The visual above captures the hierarchical relationship among the four service categories. Notice that supporting services occupy the base of the diagram because processes like nutrient cycling and soil formation operate on long timescales and create the ecological conditions necessary for everything else. When primary productivity declines—due to soil degradation or loss of decomposers—the provisioning services that supply food and water decline as well, regulating services such as carbon sequestration weaken, and even cultural services suffer as landscapes lose their ecological integrity. This cascading dependency is a central theme in APES and a frequent target of free-response questions.
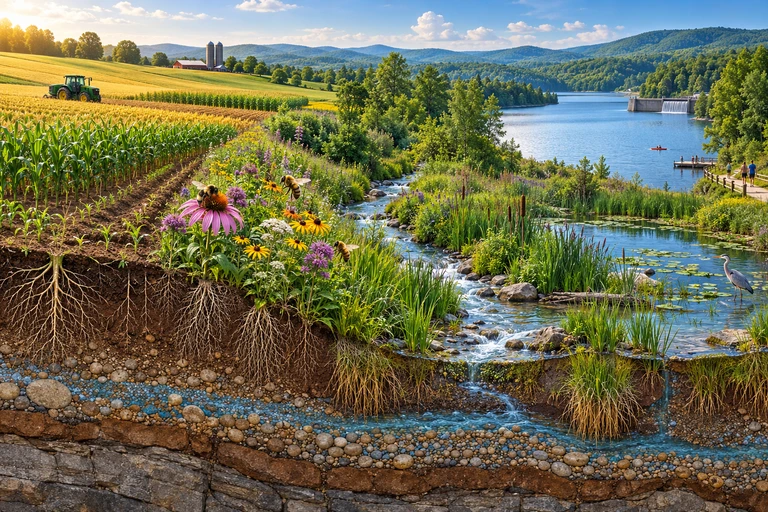 Soil processes support production, while pollination, flow attenuation, harvest and recreation provide different ecosystem-service pathways. Avoid double-counting supporting processes and the final benefits they enable.
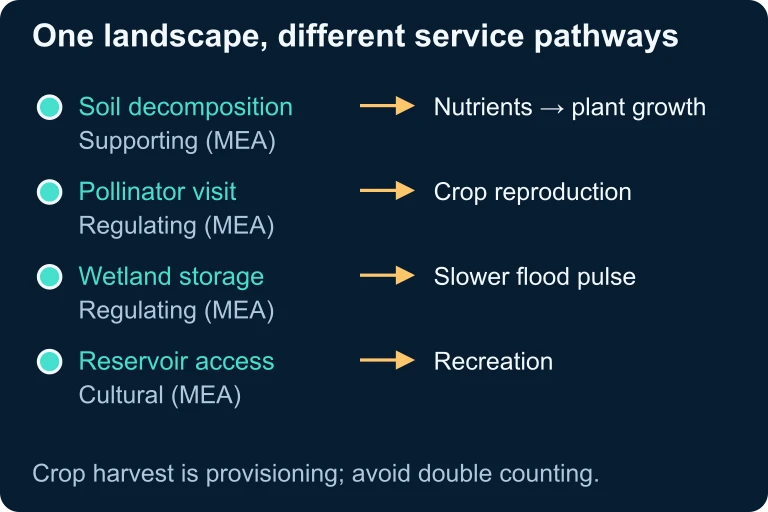 Soil processes support production, while pollination, flow attenuation, harvest and recreation provide different ecosystem-service pathways. Avoid double-counting supporting processes and the final benefits they enable.
SECTION 4
How Ecosystem Services Function
Biodiversity as the Engine of Ecosystem Services
The mechanistic link between biodiversity and ecosystem services is one of the most well-supported relationships in ecology. Higher species richness and functional diversity tend to enhance the magnitude and stability of ecosystem processes. For instance, a grassland with 16 plant species produces more biomass and sequesters more carbon than one with only 1 or 2 species, a phenomenon documented extensively in the Cedar Creek biodiversity experiments. This occurs because different species exploit slightly different resources (a concept known as niche complementarity), and because diverse communities are more likely to contain at least one species that performs exceptionally well under any given environmental condition (the sampling effect). Together, these mechanisms mean that biodiversity loss directly undermines the capacity of ecosystems to deliver services.
Economic Valuation of Ecosystem Services
While APES does not require mastery of environmental economics, the exam does expect students to understand why and how ecosystem services can be assigned economic value. Valuation methods fall into three broad approaches. Market-based valuation uses existing prices—for example, the market price of timber or fish catch. Replacement cost valuation estimates how much it would cost to replicate a service artificially, such as building a water treatment plant to replace wetland filtration. Contingent valuation surveys people to determine their willingness to pay for non-market services like scenic beauty or species preservation.
REPLACEMENT COST APPROACH
For example, if wetlands purify water at a rate equivalent to a treatment plant costing $2 million per year, and the watershed contains 500 hectares of wetland, the annual replacement cost value of that filtration service can be estimated by scaling the plant cost to the area served.
Feedback Loops and Tipping Points
Ecosystem services do not degrade linearly. Many ecological systems exhibit positive feedback loops that can accelerate decline once a threshold is crossed. Deforestation, for instance, reduces transpiration, which lowers regional rainfall, which further stresses remaining forests—a dynamic observed in the Amazon basin. Similarly, coral bleaching reduces reef structure, which diminishes coastal protection and fish nursery habitat, leading to further reef degradation through algal overgrowth. Recognizing these ecological tipping points is essential for understanding why gradual environmental damage can lead to sudden, dramatic losses of ecosystem services.
SECTION 5
Detailed Breakdown of Ecosystem Service Categories
| Service Category | Example Service | Ecological Mechanism | Threat from Biodiversity Loss |
|---|---|---|---|
| Provisioning | Wild-caught fisheries | Marine food webs support fish populations through trophic energy transfer | Overharvesting and loss of key prey species collapses fish stocks |
| Regulating | Pollination | Insects and other animals transfer pollen, enabling fruit and seed production | Pollinator decline (colony collapse, pesticides) reduces crop yields |
| Cultural | Ecotourism | Charismatic megafauna and intact landscapes attract visitors | Species extinctions and habitat degradation reduce tourism revenue |
| Supporting | Nutrient cycling | Decomposers break down organic matter, returning N, P, and K to soil | Loss of decomposer communities impairs soil fertility and plant growth |
Examples linking ecosystem service categories, mechanisms, and vulnerability to biodiversity loss
A common exam pitfall involves confusing regulating and supporting services. A useful distinction: supporting services are the underlying ecological processes (nutrient cycling, soil formation, primary production) that make other services possible, whereas regulating services are the moderating effects that ecosystems exert on environmental conditions humans experience directly, such as flood control, air quality, and disease suppression. When in doubt, ask: does this process directly moderate a condition that affects humans (regulating), or does it primarily maintain the health and function of the ecosystem itself (supporting)?
SECTION 6
Worked Example: Valuing Wetland Ecosystem Services
The following example walks through a replacement-cost valuation of a wetland's water-purification services—a scenario that appears frequently on APES free-response questions involving ecosystem services.
Estimating the Replacement Cost of Wetland Filtration
- 1
Step 1 — Identify the Scenario
A 200-hectare wetland filters agricultural runoff before it enters a municipal reservoir. A study estimates the wetland removes 85% of nitrates from the water. The city is considering draining the wetland for development. They need to know: how much would it cost to build a water treatment facility to replace the wetland's purification service? - 2
Step 2 — Gather Relevant Data
The city's water utility estimates that a treatment plant capable of handling the same volume and nitrate load would cost $6.5 million to build, with annual operating costs of $800,000. The wetland has been providing this service for free. - 3
Step 3 — Calculate Annual Value
The annual replacement cost value of the wetland's filtration service is at minimum the annual operating cost of the treatment plant: $800,000 per year. Amortized over a 30-year plant lifetime, the capital cost adds $6,500,000 ÷ 30 ≈ $216,667 per year.Total annual replacement value ≈ $800,000 + $216,667 = $1,016,667 per year - 4
Step 4 — Calculate Per-Hectare Value
Dividing the annual replacement value by the wetland area: $1,016,667 ÷ 200 ha ≈ $5,083 per hectare per year. This figure represents only the water purification service—additional services such as flood control, carbon sequestration, and habitat provision would add significantly more value.≈ $5,083 per hectare per year (water purification alone) - 5
Step 5 — Interpret and Apply
On the APES exam, you would note that this estimate is conservative because it captures only one of many services. Additionally, the replacement cost method has limitations—it assumes the artificial replacement perfectly substitutes for the natural service, which is rarely the case. A built treatment plant cannot simultaneously provide flood mitigation, wildlife habitat, or recreational opportunities.
SECTION 7
Strengths, Limitations & Comparisons of Valuation Approaches
The framework of ecosystem services is a powerful tool, but no framework is without limitations. Students should be prepared to evaluate both the utility and the criticisms of assigning economic value to nature, as the AP exam may present scenarios requiring critical analysis of conservation strategies grounded in ecosystem service valuation.
| Valuation Method | Strengths | Limitations |
|---|---|---|
| Market-Based | Uses real transaction data; straightforward and credible to policymakers; easily quantifiable for provisioning services | Only captures services with existing markets; ignores regulating and cultural services; prices may not reflect true ecological cost |
| Replacement Cost | Useful for regulating services (e.g., wetland filtration); provides tangible comparison for policymakers; highlights hidden economic value of ecosystems | Assumes artificial replacement is functionally equivalent; often underestimates because natural systems provide multiple co-benefits simultaneously |
| Contingent Valuation | Can capture non-market values (aesthetic, spiritual); applicable to cultural services; incorporates public preferences | Hypothetical bias (stated vs. actual willingness to pay); culturally variable responses; difficult to aggregate across populations |
Comparison of economic valuation methods for ecosystem services
KEY TAKEAWAY
SECTION 8
Connections to Policy, Conservation & Advanced Theory
Ecosystem services thinking has moved beyond academic research into concrete policy instruments. Understanding these connections is important for APES free-response questions that ask students to propose solutions to environmental problems, because effective solutions often involve leveraging ecosystem service frameworks.
| Concept / Policy Tool | Description | Ecosystem Service Category Addressed |
|---|---|---|
| Payments for Ecosystem Services (PES) | Financial incentives paid to landowners who maintain or restore ecosystems (e.g., Costa Rica's national PES program pays farmers to preserve forest cover) | Regulating (carbon sequestration, watershed protection) |
| Carbon Markets / REDD+ | Trading systems that assign monetary value to carbon storage in forests and other ecosystems, creating financial incentives to reduce deforestation and degradation | Regulating (climate regulation) and Supporting (primary production) |
| Wetland Mitigation Banking | Developers who destroy wetlands must purchase credits from restored or created wetland sites, ensuring no net loss of wetland ecosystem services | Regulating (flood control, water purification) and Supporting (habitat) |
| Natural Capital Accounting | Incorporating the value of natural resources and ecosystem services into national accounting systems (GDP adjustments) to give policymakers a more accurate picture of national wealth | All four categories |
Policy tools that apply ecosystem services concepts
Looking ahead, the field is moving toward what IPBES calls nature's contributions to people (NCP)—a broader framework that explicitly incorporates indigenous and local knowledge alongside Western scientific perspectives. While the MEA's four-category system remains the standard for APES, be aware that the NCP framework recognizes 18 distinct categories and emphasizes that the value of nature is context-dependent and culturally mediated. This represents a shift from viewing ecosystem services purely through an economic lens toward a more pluralistic understanding of human-nature relationships, one that acknowledges that not all contributions of nature can or should be monetized.
EXAM TIP
SECTION 9
Practice Problems
Question 1: CONCEPTUAL
- A. Serving as a nursery habitat for commercially harvested fish
- B. Protecting inland areas from storm surge damage
- C. Attracting birdwatchers who contribute to the local economy
- D. Supporting nutrient cycling through decomposition of leaf litter
Show answer (B)
Question 2: BASIC CALCULATION
- A. $240,000
- B. $600,000
- C. $1,500,000
- D. $750,000
Show answer (B)
Question 3: INTERMEDIATE
- A. Supporting services are the most economically valuable and generate the largest share of global GDP.
- B. Supporting services are foundational processes that enable provisioning, regulating, and cultural services to function.
- C. Supporting services are the easiest to replace with technological substitutes, making their degradation less noticed.
- D. Supporting services primarily affect developing nations and are therefore less likely to receive policy attention.
Show answer (B)
Question 4: APPLIED
4 ptsShow answer
Question 5: CRITICAL THINKING
4 ptsShow answer
SUMMARY
Summary: Ecosystem Services
Summary
Ecosystem services are the direct and indirect benefits that natural ecosystems provide to human societies. The Millennium Ecosystem Assessment classifies these into four categories: provisioning services (food, water, timber, medicines), regulating services (climate regulation, pollination, flood control, water purification), cultural services (recreation, aesthetic value, spiritual significance), and supporting services (nutrient cycling, soil formation, primary production). Supporting services form the ecological foundation upon which all other categories depend, meaning their degradation triggers cascading losses.
Biodiversity is the engine that drives ecosystem services through mechanisms such as niche complementarity and the sampling effect. Economic valuation methods—market-based, replacement cost, and contingent valuation—translate ecological value into economic terms to inform policy. Tools like payments for ecosystem services (PES), carbon markets, and wetland mitigation banking represent real-world applications of this framework. On the APES exam, always connect ecosystem service loss to specific biodiversity mechanisms and propose solutions that restore both ecological function and human benefit.