

SECTION 1
Historical Context & Motivation
Throughout most of human history, the planet's regenerative capacity far exceeded the demands placed upon it by relatively small, agrarian populations. The Industrial Revolution, however, initiated an exponential increase in resource consumption—fossil fuels, timber, arable land, and fisheries—that accelerated through the twentieth century. By the 1970s, environmental scientists recognized that growth-oriented economic models failed to account for the finite nature of Earth's ecosystems. The question became urgent: how can we measure whether humanity's total demand exceeds what the biosphere can regenerate? This question drove the development of the ecological footprint concept—a metric that translates diverse categories of resource use into a single, comparable unit of biologically productive land.
1972 • Limits to Growth Published
1987 • Brundtland Report
1992 • Ecological Footprint Concept Introduced
2003 • Global Footprint Network Founded
2023 • Earth Overshoot Day Falls in August
The central gap that the ecological footprint addresses is the absence of a standardized accounting tool capable of comparing human demand against nature's supply across nations, resource categories, and time. Without such a metric, policymakers cannot determine whether a given level of consumption is sustainable or identify which sectors drive overshoot most acutely.
SECTION 2
Core Principles & Definitions
The ecological footprint framework rests on a straightforward premise: every human activity requires biologically productive land or water to provide resources and absorb wastes. By summing these demands and expressing them in a common unit—the global hectare (gha)—we can compare total demand against the planet's biocapacity, defined as the total amount of biologically productive area available to regenerate what people demand from nature. When a population's footprint exceeds its biocapacity, it operates in ecological deficit; when biocapacity exceeds the footprint, a biocapacity reserve exists.
Global Hectare (gha)
Biocapacity
Ecological Deficit / Reserve
Earth Overshoot Day
Carbon Footprint Component
SECTION 3
Visual Explanation: Footprint vs. Biocapacity
The diagram illustrates a critical dynamic: while global biocapacity has increased modestly—thanks to improved agricultural yields—it has not kept pace with the explosive growth in the ecological footprint driven primarily by rising fossil-fuel emissions. The divergence between the two curves represents the ecological deficit, which manifests as deforestation, fishery collapse, soil degradation, and accumulating atmospheric CO₂. On the AP exam, you should be prepared to interpret graphs like this and explain what happens ecologically when the footprint curve exceeds the biocapacity curve.
SECTION 4
Mathematical Framework
Although the full National Footprint Accounts involve complex datasets, the AP exam focuses on a simplified quantitative framework. Understanding the core equations enables you to calculate footprints, compare nations, and determine how many Earths a given consumption pattern would require.
ECOLOGICAL FOOTPRINT (TOTAL)
Where Dᵢ = annual demand for resource category i (tonnes or m³), Yᵢ = national average yield for category i (tonnes per hectare), and EQFᵢ = equivalence factor that converts category-specific hectares into global hectares (gha).
NUMBER OF EARTHS
A value greater than 1 indicates global overshoot. This is the metric most commonly tested on the AP exam.
PER CAPITA ECOLOGICAL FOOTPRINT
Per capita values allow fair comparisons between countries of vastly different population sizes. High-income nations typically range from 4–8 gha/person; low-income nations often fall below 1.5 gha/person.
EARTH OVERSHOOT DAY
This yields the calendar day (counted from January 1) on which humanity's demand exceeds one year's worth of regeneration. A smaller number means earlier overshoot—i.e., a larger deficit.
SECTION 5
Footprint Components by Land-Use Category
The ecological footprint is disaggregated into six land-use categories, each reflecting a distinct dimension of human demand on the biosphere. Understanding these categories is essential for identifying which sectors drive overshoot and where interventions would be most effective.
Approximate Share of Global Ecological Footprint by Component
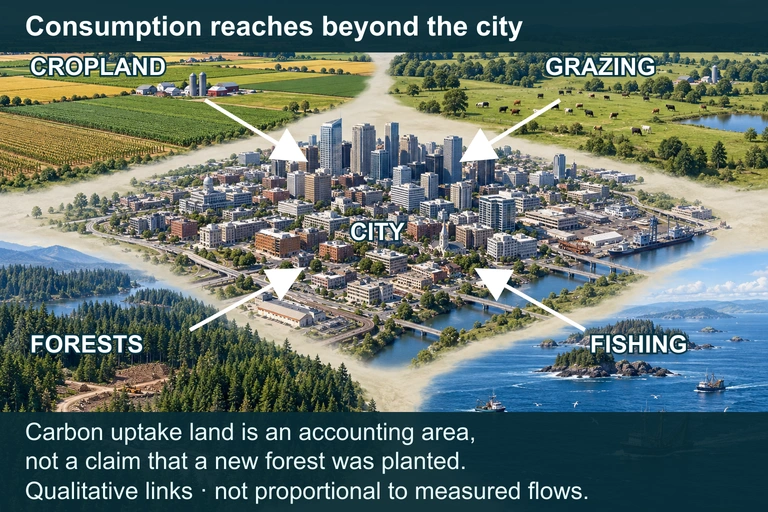 Urban consumption depends on productive landscapes beyond the city boundary. These category windows show connections rather than measured land areas.
SECTION 6
Worked Example: Calculating Earths Required
Worked example
- 1
Step 1 — Identify Given Values
Country X has a per capita ecological footprint of 8.1 gha/person. The global biocapacity available per person is 1.6 gha/person (Earth's total biocapacity ≈ 12.2 billion gha divided by a world population of ≈ 8.0 billion). - 2
Step 2 — Apply the Number-of-Earths Formula
Number of Earths = Per capita footprint ÷ Per capita biocapacity = 8.1 gha ÷ 1.6 gha. - 3
Step 3 — Compute
8.1 ÷ 1.6 = 5.06 Earths. If every person on Earth consumed at Country X's rate, we would need slightly more than five planet Earths to sustain demand without depleting natural capital.≈ 5.1 Earths required - 4
Step 4 — Interpret
This result means Country X operates at a massive ecological deficit. The difference between demand and supply is met by drawing down stocks (e.g., depleting fisheries or forests) and by externalizing waste (e.g., accumulating CO₂ in the atmosphere). Reducing the carbon footprint component—the dominant share—offers the highest-leverage pathway to closing this gap.
SECTION 7
Strengths & Limitations of the Ecological Footprint
| Strengths | Limitations |
|---|---|
| Aggregates diverse resource demands into a single, intuitive metric (gha), facilitating cross-national comparisons. | Does not capture water use, pollution toxicity, or biodiversity loss directly; these are separate indicators. |
| Communicates sustainability clearly to policymakers and the public through concepts like Earth Overshoot Day. | Relies on national-average yield data that may obscure regional variation in productivity and technology. |
| Updated annually by the Global Footprint Network for over 200 countries, enabling trend analysis. | The carbon component dominates, so the metric largely tracks fossil fuel use rather than providing balanced resource accounting. |
| Highlights equity issues: per capita footprints reveal consumption disparities between high- and low-income nations. | Assumes carbon sequestration by forests as the only sink for CO₂, ignoring ocean uptake and potential CCS technology. |
Key strengths and limitations of ecological footprint analysis
Key takeaway
SECTION 8
Connections to Broader Sustainability Frameworks
The ecological footprint does not exist in isolation; it intersects with several frameworks tested on the AP Environmental Science exam. Understanding how these models complement one another strengthens your ability to analyze FRQ scenarios that require multi-metric reasoning.
| Framework | Key Focus | Relationship to Ecological Footprint |
|---|---|---|
| IPAT Model | I = P × A × T; decomposes impact into population, affluence, technology | The footprint reflects the product of these three drivers; rising A (affluence) and P (population) increase the footprint unless T (technology) offsets them. |
| Planetary Boundaries | Nine biophysical thresholds (climate, biodiversity, nitrogen cycle, etc.) | The footprint's carbon component maps onto the climate boundary, but other boundaries (freshwater, chemical pollution) are not captured. |
| Water Footprint | Total freshwater consumption (blue, green, grey water) | Complements the ecological footprint by addressing the major gap: water use is not included in gha accounting. |
| Life Cycle Assessment (LCA) | Cradle-to-grave environmental impacts of a product | LCA provides granular product-level data that feeds into aggregate national footprint accounts. |
Looking forward, researchers are refining footprint methodology to incorporate freshwater demand, incorporate ecosystem services valuation, and link to the UN Sustainable Development Goals. On the AP exam, expect questions that ask you to evaluate the ecological footprint alongside other indicators, recognizing that no single metric captures all dimensions of sustainability.
SECTION 9
Practice Problems
Question 1: CONCEPTUAL
- A. The country has a large population that distributes the footprint across many people.
- B. The country has vast, highly productive land area relative to its population, so biocapacity per capita exceeds the footprint.
- C. The country imports most of its resources, so its footprint is counted in other nations.
- D. The country's carbon emissions are absorbed entirely by its oceans, reducing the footprint to zero.
Show answer (B)
Question 2: BASIC CALCULATION
- A. 2.5 Earths
- B. 3.75 Earths
- C. 5.6 Earths
- D. 6.0 Earths
Show answer (B)
Question 3: INTERMEDIATE
- A. Country A has a larger ecological deficit per person than Country B.
- B. Country B is more sustainable because its footprint is smaller.
- C. Country A is more sustainable because it has more biocapacity per person.
- D. Both countries have identical per capita ecological deficits.
Show answer (D)
Question 4: APPLIED
Show answer
Question 5: CRITICAL THINKING