

SECTION 1
Historical Context & Motivation
Humans have long recognized that climate varies dramatically across the planet—ancient Greek scholars divided the known world into klimata (zones of inclination) based on the angle of the sun above the horizon. This intuition that solar geometry drives regional weather patterns remained qualitative for centuries, until explorers, naturalists, and physicists began assembling quantitative frameworks that linked latitude, ocean currents, and atmospheric circulation into a coherent picture of global climate. Understanding this history is essential because the same principles that explain why the Sahara is arid and the Amazon is wet also underpin modern predictions about climate change and ecosystem distribution.
~350 BCE • Aristotle's Klimata
1735 • Hadley's Circulation Model
1884 • Ferrel & Polar Cells Described
1918 • Köppen Climate Classification
1990 • First IPCC Report
The central question these scientists pursued—and the one this lesson addresses—is deceptively simple: Why does climate vary so predictably with geography? Answering it requires integrating concepts from astronomy (axial tilt and seasonality), physics (energy balance and convection), and geography (ocean currents, topography, and the Coriolis effect). Together, these factors produce the biome distribution patterns that the AP Environmental Science exam expects you to explain and apply.
SECTION 2
Core Principles of Earth's Climate System
Earth's climate patterns emerge from the interplay of a small number of governing principles. Solar energy input varies by latitude because of Earth's spherical shape and its 23.5° axial tilt, producing differential heating that drives atmospheric and oceanic circulation. These circulations redistribute heat from the equator toward the poles, but geographic features—mountain ranges, continental positions, and ocean basins—modify the circulation locally, creating the mosaic of climates we observe.
Unequal Solar Heating
Axial Tilt & Seasons
Atmospheric Circulation Cells
Coriolis Effect
Ocean Currents & Topography
SECTION 3
Visual Explanation — Global Circulation & Climate Zones
The diagram above illustrates the fundamental engine behind Earth's climate zones. At the Intertropical Convergence Zone (ITCZ) near the equator, intense solar heating causes air to rise, cool adiabatically, and release moisture as heavy tropical rainfall—this is why equatorial regions host tropical rainforests. The now-dry air moves poleward aloft and descends at roughly 30° latitude, creating the subtropical high-pressure belt associated with the world's great deserts (Sahara, Arabian, Sonoran). In the Ferrel cell (30°–60°), surface air flows poleward and is deflected into the prevailing westerlies, picking up moisture from oceans and delivering it to temperate continental interiors. Finally, the Polar cell produces cold, dense, sinking air over the poles, resulting in polar deserts with extremely low precipitation despite the presence of ice.
SECTION 4
How It Works — Energy Balance & Seasonality
The amount of solar energy received per unit area on Earth's surface depends on the angle at which sunlight strikes that surface. This relationship can be expressed quantitatively and is central to understanding why equatorial regions are warmer than polar ones, and why seasons occur.
SOLAR INTENSITY BY LATITUDE
Where I = intensity of solar radiation at surface (W/m²), S = solar constant (≈ 1361 W/m²), and θ = zenith angle (angle of sunlight from vertical). At the equator during equinox, θ ≈ 0° so cos(θ) = 1; at 60° latitude, θ ≈ 60° so cos(60°) = 0.5, meaning half the energy per unit area.
EARTH'S ENERGY BALANCE
Where α = planetary albedo (≈ 0.30), σ = Stefan-Boltzmann constant (5.67 × 10⁻⁸ W/m²·K⁴), T = effective radiating temperature, and r = Earth's radius. Solving gives T ≈ 255 K (−18 °C); the greenhouse effect adds ~33 °C to reach Earth's actual average of ~288 K (15 °C).
Earth's axial tilt of 23.5° means that as Earth orbits the sun, the subsolar point (where the sun is directly overhead at noon) migrates between 23.5°N (Tropic of Cancer, June solstice) and 23.5°S (Tropic of Capricorn, December solstice). This migration shifts the ITCZ and associated precipitation belts, producing wet and dry seasons in tropical and subtropical regions. The tilt also causes dramatic seasonal variation in day length at high latitudes, amplifying temperature swings that define temperate and polar climates.
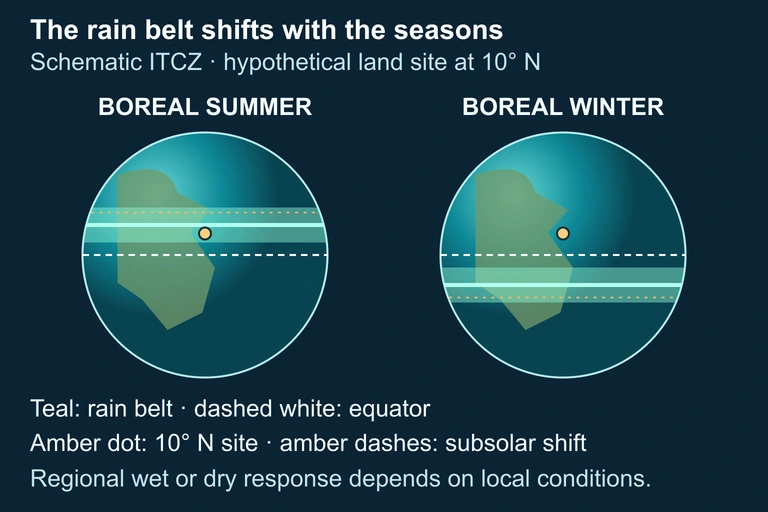 Seasonal movement of tropical convergence can alter rainfall at a location. Regional geography and atmospheric circulation modify the simplified seasonal pattern.
SECTION 5
Climate Zones & Biome Distribution
The interaction of atmospheric circulation, ocean currents, and topography produces distinct climate zones that map onto characteristic terrestrial biomes. The Köppen climate classification organizes these zones using temperature and precipitation thresholds, and the AP exam expects familiarity with the major categories and the physical mechanisms that produce them.
Several important patterns emerge from this framework. First, the world's major deserts cluster near 30° latitude in both hemispheres because of descending dry air in the Hadley cell. Second, the western coasts of continents at subtropical latitudes often experience cold-water upwelling (e.g., California Current, Benguela Current) that stabilizes the air column, suppressing precipitation and producing coastal fog deserts. Third, orographic precipitation creates dramatic contrasts over short distances: the Olympic Peninsula in Washington state receives over 3,500 mm of rain annually on its windward slopes, while the city of Sequim just 50 km to the east receives less than 400 mm, well within semi-arid range. The AP exam may ask you to predict biome type from a description of latitude, proximity to the coast, and nearby topography.
SECTION 6
Worked Example — Predicting Climate from Geography
Worked example
- 1
Step 1 — Read the Scenario
A location sits at 28°N latitude on the western coast of a continent. A cold ocean current runs along the coast. Mountains rise 50 km inland. Determine the likely biome on the coast and on the leeward side of the mountains. - 2
Step 2 — Apply Latitude to Circulation Model
At 28°N, the location falls within the descending limb of the Hadley cell—the subtropical high-pressure zone. This means the baseline climate tendency is dry and warm.Subtropical high → dry conditions expected - 3
Step 3 — Factor in the Cold Ocean Current
Cold currents along western continental coasts suppress evaporation and stabilize the lower atmosphere. This further reduces precipitation and may produce coastal fog. The result is a coastal desert or semi-arid climate (e.g., analogous to Baja California or the Namib Desert coast).Coastal biome: hot desert or xeric shrubland - 4
Step 4 — Consider the Mountains (Orographic Effect)
Any occasional moisture-laden air from the ocean that is forced upward over the mountains would release precipitation on the windward (western) slope. However, since the base climate is already very dry due to the subtropical high and cold current, even the windward slope receives limited rainfall. The leeward (eastern) side sits in a rain shadow, intensifying aridity.Leeward biome: extreme hot desert (e.g., sand dune fields) - 5
Step 5 — Synthesize the Answer
The coastal zone is a hot coastal desert with possible fog influence, while the leeward interior is an even more extreme desert due to the compounding effects of subtropical subsidence, cold-current aridity, and the orographic rain shadow.Three reinforcing mechanisms: subtropical high + cold current + rain shadow → extreme desert
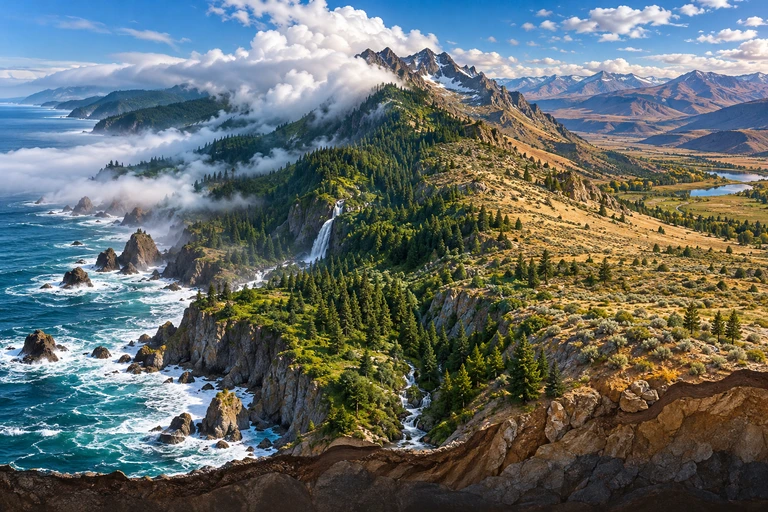 Ocean influence and mountain lifting can produce contrasting climates at the same latitude. A rain shadow develops when moisture-bearing air rises across a mountain and descends on the leeward side.
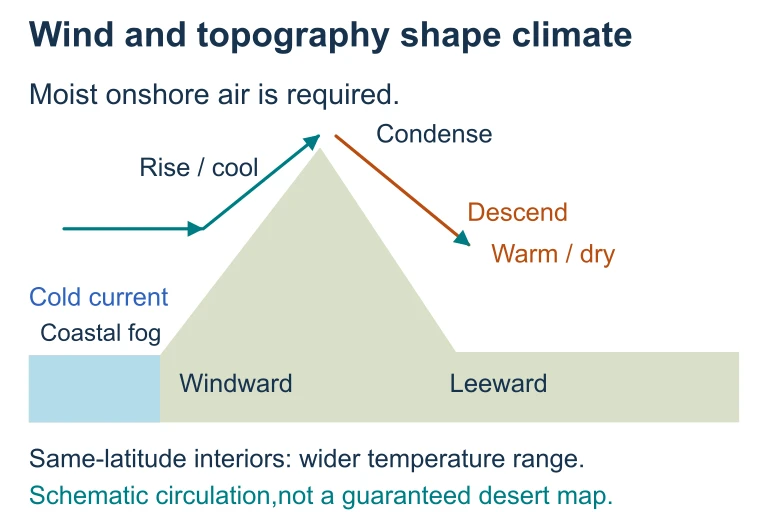 Ocean influence and mountain lifting can produce contrasting climates at the same latitude. A rain shadow develops when moisture-bearing air rises across a mountain and descends on the leeward side.
SECTION 7
Comparing Climate-Influencing Factors
| Factor | Effect on Temperature | Effect on Precipitation |
|---|---|---|
| Latitude | Lower latitudes warmer; higher latitudes cooler due to solar angle | Indirectly determines circulation cell position and associated wet/dry zones |
| Altitude | Temperature drops ~6.5 °C per 1,000 m (environmental lapse rate) | Orographic lifting increases windward precipitation; rain shadow decreases leeward |
| Ocean Currents | Warm currents raise coastal temps (e.g., Gulf Stream); cold currents lower them (e.g., California Current) | Warm currents add moisture; cold currents stabilize air, reducing rainfall |
| Continentality | Interior locations have wider annual temp ranges; coastal locations are moderated | Distance from moisture sources reduces precipitation inland |
| Albedo | High albedo surfaces (ice, snow) reflect solar energy, keeping temps low (positive feedback) | Albedo changes affect energy balance but not precipitation directly |
Summary of major climate-influencing geographic factors
SECTION 8
Connection to Climate Change & Advanced Topics
The geographic principles governing climate zones are not static. Anthropogenic climate change is altering the energy balance equation by increasing the concentration of greenhouse gases, which enhances the greenhouse effect beyond its natural ~33 °C contribution. This perturbation is causing measurable shifts in established climate patterns: the Hadley cells are expanding poleward by approximately 0.5° latitude per decade, pushing subtropical dry zones into previously temperate regions and shifting storm tracks. These changes have direct consequences for agriculture, water resources, and biodiversity.
| Concept | Current Understanding (This Lesson) | Advanced / Climate Change Context |
|---|---|---|
| Hadley Cell Extent | Descending limb at ~30° latitude creating subtropical deserts | Hadley cells expanding poleward, extending arid zones into Mediterranean and temperate regions |
| ITCZ Position | Migrates seasonally between ~23.5°N and 23.5°S | Differential warming may shift ITCZ northward, altering monsoon patterns across Africa and Asia |
| Albedo | Ice and snow reflect solar energy, maintaining polar cold | Ice-albedo feedback: melting ice exposes dark ocean/land → absorbs more heat → accelerates warming |
| Ocean Currents | Thermohaline circulation distributes heat globally | Freshwater from melting Greenland ice could weaken AMOC, paradoxically cooling NW Europe |
How climate change modifies established geographic-climate relationships
Looking ahead, the AP Environmental Science curriculum connects this foundational geography-climate framework to units on global climate change, biodiversity loss, and land/water use. Understanding that biomes exist because of predictable physical mechanisms—not randomly—is what allows scientists to project how rising global temperatures will redistribute ecosystems. If the Hadley cell's descending limb shifts poleward, for instance, regions currently supporting temperate grasslands may transition toward semi-arid conditions, with profound implications for food production.
SECTION 9
Practice Problems
Question 1: CONCEPTUAL
- A. These latitudes receive the least total sunlight annually due to Earth's axial tilt.
- B. Air that rises at the ITCZ moves poleward aloft, loses moisture, and descends as dry air at approximately 30° latitude.
- C. Cold ocean currents are exclusively found at 30° latitude, suppressing evaporation entirely.
- D. The Coriolis effect is strongest at 30° latitude, preventing moist air masses from forming.
Show answer (B)
Question 2: BASIC CALCULATION
- A. 680 W/m²
- B. 962 W/m²
- C. 1180 W/m²
- D. 1361 W/m²
Show answer (B)
Question 3: INTERMEDIATE
- A. Seasonal migration of the subtropical high-pressure zone northward in summer, blocking moist air, and its retreat in winter, allowing mid-latitude cyclones to bring precipitation
- B. Monsoon circulation caused by differential heating of land and ocean surfaces
- C. A permanent cold ocean current that suppresses precipitation year-round except when El Niño events bring warm water
- D. Orographic lifting on the windward side of coastal mountains that produces rainfall only in winter months
Show answer (A)
Question 4: APPLIED
Show answer
Question 5: CRITICAL THINKING