

SECTION 1
Historical Context & Motivation
The idea that the severity of a poison's effect depends on how much of it enters the body seems intuitive today, but it took centuries to formalize this relationship into a quantitative science. The dose-response curve is the graphical representation of the relationship between the amount of a substance an organism is exposed to and the magnitude of the biological effect it produces. This concept lies at the heart of toxicology, environmental regulation, and risk assessment, enabling scientists to determine safe exposure thresholds and identify hazardous pollutant concentrations in air, water, and soil.
1538 • Paracelsus — "The Dose Makes the Poison"
1927 • Trevan Introduces LD₅₀
1954 • Probit Analysis and Dose-Response Modeling
1970s • EPA and Regulatory Toxicology
2000s • Non-Monotonic and Endocrine Disruptor Debates
The central question the dose-response curve addresses is deceptively simple: How much of a pollutant is too much? Without quantitative dose-response data, environmental regulators cannot set meaningful standards for pollutant concentrations in drinking water, determine safe pesticide application rates, or evaluate the risk posed by industrial discharges to aquatic ecosystems.
SECTION 2
Core Principles & Definitions
A dose-response relationship describes how the dose (amount of substance per unit body weight or per unit time) produces a graded or quantal response (a measurable biological effect such as mortality, enzyme inhibition, or behavioral change) in a population of organisms. When this relationship is plotted on a graph, the resulting curve typically takes the shape of a sigmoid (S-shaped) function, with the dose on the x-axis and the cumulative response percentage on the y-axis.
Dose
Threshold Dose
LD₅₀ / LC₅₀
ED₅₀ / EC₅₀
NOAEL & LOAEL
SECTION 3
Visual Explanation — The Sigmoid Dose-Response Curve
The sigmoid shape emerges because individual organisms within a population have variable susceptibility to a toxicant. At low doses, only the most sensitive organisms respond; as the dose increases, a greater fraction of the population is affected until nearly all individuals have responded and the curve levels off. When dose is plotted on a logarithmic scale, the central portion of the curve becomes approximately linear, which is useful for interpolating the LD₅₀ with minimal error. The steepness of the linear region indicates how uniformly sensitive the population is: a steep slope means most individuals respond over a narrow dose range, while a shallow slope indicates wide variability in sensitivity.
SECTION 4
Mathematical Framework
While the AP Environmental Science exam does not require you to derive dose-response equations, understanding the mathematical underpinnings helps you interpret data tables and perform LD₅₀-related calculations. The classic dose-response relationship is modeled by the Hill equation (also called the four-parameter logistic model), and environmental risk assessors routinely convert experimentally determined values into regulatory standards using safety factors.
HILL EQUATION (DOSE-RESPONSE MODEL)
D = dose administered (mg/kg); LD₅₀ = dose at 50% response; n = Hill coefficient (slope factor). When n > 1, the curve is steep; when n < 1, the curve is shallow.
REFERENCE DOSE (RfD) — REGULATORY SAFETY
RfD = reference dose (mg/kg/day), the estimated daily exposure unlikely to cause harm over a lifetime; NOAEL = No Observed Adverse Effect Level from animal studies; UF = uncertainty factors (typically 10× each for animal-to-human extrapolation, sensitive subpopulations, and data gaps).
TOXICITY COMPARISON
A substance with an LD₅₀ of 5 mg/kg is far more acutely toxic than one with an LD₅₀ of 5,000 mg/kg, because a much smaller dose kills 50% of the test population.
SECTION 5
Comparing Dose-Response Curves for Multiple Substances
One of the most powerful applications of dose-response curves is placing multiple substances on the same set of axes to compare their relative toxicity and potency. A curve shifted to the left indicates a substance with a lower LD₅₀ — it requires less chemical to produce the same effect, meaning it is more toxic. A steeper slope indicates a population that transitions from minimal response to maximum response over a narrow range of doses.
| Toxicity Category | LD₅₀ (oral, rat, mg/kg) | Example Substance |
|---|---|---|
| Super toxic | < 5 | Botulinum toxin, dioxin (TCDD) |
| Extremely toxic | 5 – 50 | Nicotine, strychnine |
| Very toxic | 50 – 500 | DDT, lead salts |
| Moderately toxic | 500 – 5,000 | Table salt (NaCl), aspirin |
| Slightly toxic | > 5,000 | Ethanol, sucrose |
EPA toxicity categories based on oral LD₅₀ in rats
SECTION 6
Worked Example — Calculating Reference Dose
A new industrial solvent is tested on laboratory rats. The NOAEL from a subchronic feeding study is determined to be 8 mg/kg/day. The EPA requires three uncertainty factors: 10× for animal-to-human extrapolation, 10× for variability among humans (sensitive subpopulations), and 10× for converting from subchronic to chronic exposure data. Calculate the reference dose (RfD).
Worked example
- 1
Step 1 — Identify Given Values
NOAEL = 8 mg/kg/day. Uncertainty factors: UF₁ = 10 (animal → human), UF₂ = 10 (human variability), UF₃ = 10 (subchronic → chronic). - 2
Step 2 — Compute Total Uncertainty Factor
Total UF = UF₁ × UF₂ × UF₃ = 10 × 10 × 10 = 1,000.Total UF = 1,000 - 3
Step 3 — Apply the RfD Formula
RfD = NOAEL / Total UF = 8 mg/kg/day ÷ 1,000 = 0.008 mg/kg/day.RfD = 0.008 mg/kg/day - 4
Step 4 — Interpret the Result
This means that a daily exposure of 0.008 mg of the solvent per kg of body weight is considered unlikely to produce adverse health effects in humans over a lifetime. For a 70 kg adult, this translates to an intake corresponding to this reference dose of 0.008 × 70 = 0.56 mg/day. A reference dose is an estimate with uncertainty, not a sharp boundary guaranteeing safety below it or harm above it. This 70 kg example is a hypothetical conversion, not individualized advice.Reference-dose intake for 70 kg adult ≈ 0.56 mg/day
SECTION 7
Strengths & Limitations of Dose-Response Analysis
| Strengths | Limitations |
|---|---|
| Provides standardized, quantitative endpoints (LD₅₀, EC₅₀) for comparing toxicity across substances | Data typically derived from animal models — extrapolation to humans introduces uncertainty |
| Enables regulatory agencies to set enforceable exposure limits (RfD, MCL) | Tests usually involve single substances, but real-world exposure involves mixtures with synergistic or antagonistic interactions |
| Reproducible methodology allows studies to be validated and compared globally | Assumes a threshold exists for non-carcinogens, which may not hold for endocrine disruptors at very low doses |
| Sigmoid model captures population variability in susceptibility | Does not account for chronic low-level exposure or bioaccumulation over time without additional modeling |
Strengths and limitations of dose-response analysis
SECTION 8
Connection to Environmental Risk Assessment
In practice, the dose-response curve is only one of four steps in the formal risk assessment framework established by the National Academy of Sciences in 1983. The four steps are: (1) hazard identification — does the substance cause harm?; (2) dose-response assessment — at what doses does harm occur?; (3) exposure assessment — how much of the substance are people actually encountering?; and (4) risk characterization — what is the probability and severity of harm given realistic exposure? Dose-response data feed directly into step 2, but the regulatory decisions ultimately depend on integrating all four steps.
| Traditional Dose-Response | Advanced Risk Models |
|---|---|
| Single substance tested in isolation | Cumulative risk assessment models for chemical mixtures |
| Assumes monotonic (always increasing) response | Non-monotonic models for endocrine disruptors (low-dose effects) |
| Typically acute exposure (single dose) | Chronic exposure models incorporating bioaccumulation and half-life |
| LD₅₀ measured in lab animals | In vitro (cell-based) and computational (QSAR) methods reducing animal use |
Traditional vs. advanced approaches to dose-response analysis
As environmental science advances, the field is moving toward probabilistic dose-response models that incorporate variability in exposure, individual genetics, and cumulative impacts from multiple stressors. For the AP exam, understanding the classical sigmoid model, knowing how to read LD₅₀ values from a graph, and being able to calculate a reference dose remain the essential skills — but recognizing the limitations of the single-substance, single-endpoint approach is what separates strong essays from average ones on the FRQ.
 The modeled baseline assumes continuous, intact containment. The foreground bund wall and ground are cut away for visibility, not shown as a breach. Blue highlights indicate water in pore spaces, not pollutant concentration or measured flow. Hazard alone does not establish exposure; the companion shows a conditional failure pathway without inferring an actual leak, probability or dose. The omitted front wall is a cutaway convention; the containment structure is continuous.
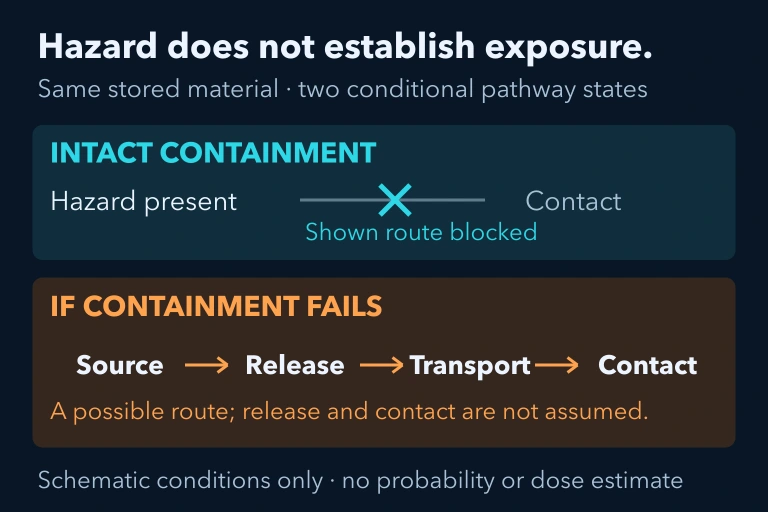 Intact containment can block exposure; failure permits release, transport and contact only if each pathway stage occurs.
SECTION 9
Practice Problems
Question 1: CONCEPTUAL
- A. Substance Y is more toxic because it has a larger LD₅₀ value.
- B. Substance X is more toxic because a smaller dose kills 50% of the test population.
- C. Substance X and Y are equally toxic because LD₅₀ only measures acute exposure.
- D. Substance Y is more potent because more of it is required to cause a response.
Show answer (B)
Question 2: BASIC CALCULATION
- A. 0.5 mg/kg/day
- B. 0.05 mg/kg/day
- C. 50 mg/kg/day
- D. 500 mg/kg/day
Show answer (B)
Question 3: INTERMEDIATE
- A. Chemical A is more toxic and affects all individuals at nearly the same dose.
- B. Chemical B is more toxic, and Chemical A affects organisms over a narrower range of doses.
- C. Chemical A has a lower threshold dose than Chemical B.
- D. Both chemicals have equal potency because the curves appear on the same graph.
Show answer (B)
Question 4: APPLIED
Show answer
Question 5: CRITICAL THINKING