

SECTION 1
Historical Context & Motivation
The story of human civilization is inseparable from the story of energy. For millennia, societies relied on biomass—primarily wood and animal dung—as their dominant fuel, but the spatial constraints of these resources shaped where settlements could thrive. The discovery that certain regions harbored concentrated deposits of coal, petroleum, and natural gas transformed geopolitics, economics, and the environment in ways that continue to reverberate. Understanding why energy resources are unevenly distributed—and how that unevenness drives global trade, conflict, and environmental degradation—is essential for any student of environmental science.
1760s • Coal Launches the Industrial Revolution
1859 • Drake's Oil Well in Pennsylvania
1960 • OPEC Founded
1973 • Oil Embargo & Energy Crisis
2015 • Paris Agreement
This historical arc raises a central question for environmental science: What geological, climatic, and tectonic processes determine where energy resources are found? Answering that question requires an understanding of both the deep-time formation of fossil fuels and the atmospheric and hydrological factors that govern renewable energy potential. It also demands attention to the environmental and social consequences of extraction, transport, and consumption.
SECTION 2
Core Principles of Energy Resource Distribution
Energy resources fall into two broad categories—nonrenewable and renewable—and the geological and atmospheric processes that govern their distribution differ fundamentally. Nonrenewable resources such as coal, petroleum, natural gas, and uranium formed over millions of years under specific pressure-temperature regimes in sedimentary basins and igneous intrusions. Renewable resources such as solar, wind, hydroelectric, and geothermal energy depend on ongoing atmospheric, hydrological, and tectonic activity. The following principles underpin how and why these resources cluster in particular regions.
Geological Time & Sedimentation
Plate Tectonics & Heat Flow
Solar Insolation & Latitude
Atmospheric Circulation & Wind
Hydrological Cycle & Topography
KEY TAKEAWAY
SECTION 3
Mapping Global Energy Resource Distribution
The diagram below provides a schematic representation of how the world's major energy resources are distributed across latitude bands and tectonic settings. Each resource type occupies a distinct niche determined by the interplay of geological history and present-day climate. Note how fossil fuels cluster in former sedimentary basins, while renewable resources align with atmospheric and tectonic features that operate on much shorter timescales.
Several patterns emerge from this geographic overview. Petroleum and natural gas concentrate around 20°–40° N latitude, corresponding to the ancient Tethys Sea margin where organic-rich marine sediments accumulated. Coal deposits span a wider range of latitudes because the Carboniferous and Permian swamp forests existed across Pangaea. Meanwhile, solar potential peaks in subtropical desert belts near 20°–30° latitude where descending air in Hadley cells suppresses cloud formation. Geothermal resources trace the Pacific Ring of Fire and mid-ocean ridges, following the boundaries of tectonic plates where heat flow is greatest.
SECTION 4
Formation Mechanisms & Quantitative Relationships
Fossil Fuel Formation
The formation of fossil fuels requires the burial of organic material under conditions that prevent complete aerobic decomposition. Over geological time, increasing temperature and pressure convert kerogen (solid organic precursor) into petroleum, natural gas, or coal depending on the type of source material and the thermal history of the basin. The critical temperature ranges define what geologists call the oil window and gas window. The petroleum system concept—source rock, reservoir rock, cap rock, trap, and thermal maturation—explains why oil and gas accumulate in specific structural and stratigraphic configurations.
SOLAR INSOLATION
Where I = insolation at the surface (W/m²), I₀ = solar constant (≈ 1,361 W/m²), and θ = zenith angle. At higher latitudes, θ increases, reducing insolation and therefore solar energy potential.
HYDROELECTRIC POWER
Where P = power (W), η = turbine efficiency (typically 0.85–0.90), ρ = water density (1,000 kg/m³), g = gravitational acceleration (9.8 m/s²), Q = volumetric flow rate (m³/s), and h = hydraulic head (m). Regions with high precipitation and steep topography maximize both Q and h.
WIND POWER DENSITY
Where P/A = power per unit area (W/m²), ρ_air = air density (≈ 1.225 kg/m³ at sea level), and v = wind speed (m/s). Because power scales with the cube of wind speed, even small increases in average wind speed dramatically increase energy potential.
These equations illustrate a critical insight: the distribution of renewable energy resources is governed by quantifiable physical parameters that vary predictably with latitude, altitude, and geography. A location at the equator with clear skies receives roughly twice the annual solar insolation of a location at 60° N, and a site with 8 m/s average winds produces eight times the power density of a site with 4 m/s winds (since 8³/4³ = 8). These quantitative relationships explain why nations invest heavily in mapping wind speeds, solar irradiance, and river discharge as they plan energy infrastructure.
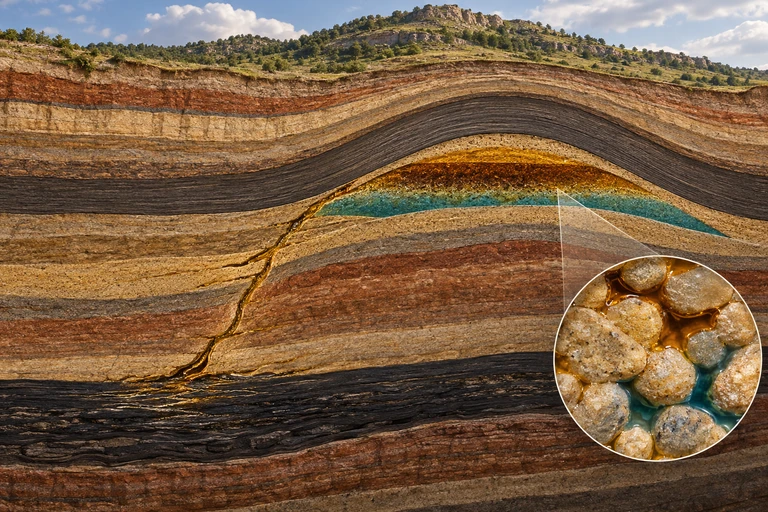 A petroleum system combines organic-rich source rock, migration pathways, porous reservoir rock and a trapping seal. Fluids occupy connected pore spaces within rock.
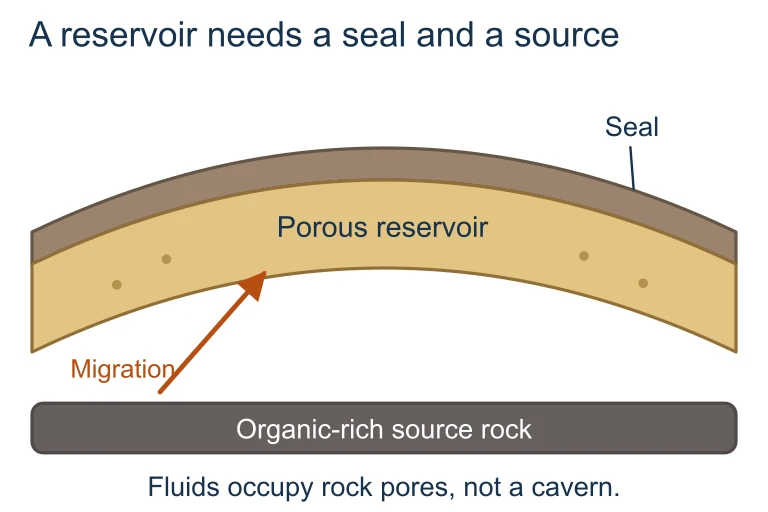 A petroleum system combines organic-rich source rock, migration pathways, porous reservoir rock and a trapping seal. Fluids occupy connected pore spaces within rock.
 A 50 m rotor radius sweeps 7,854 m². At air density 1.225 kg/m³ and wind speed 8 m/s, available kinetic power is 2.463 MW; an assumed 40% overall efficiency gives 0.985 MW of electricity at that operating point.
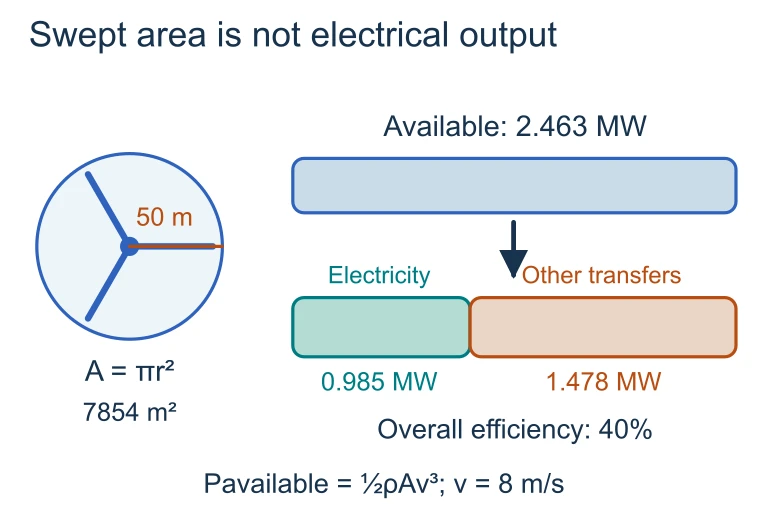 A 50 m rotor radius sweeps 7,854 m². At air density 1.225 kg/m³ and wind speed 8 m/s, available kinetic power is 2.463 MW; an assumed 40% overall efficiency gives 0.985 MW of electricity at that operating point.
SECTION 5
Classification of Energy Resources & Their Global Distribution
Energy resources can be classified along multiple axes: by origin (fossil vs. nuclear vs. renewable), by renewability (nonrenewable vs. renewable), and by the physical processes that determine their location. The table below summarizes the major energy resources tested on the AP Environmental Science exam, the geological or climatic factors that control their distribution, and the regions where they are most abundant.
| Energy Resource | Formation / Source | Key Distribution Factors | Major Regions |
|---|---|---|---|
| Coal | Carboniferous/Permian swamp forests; peat → lignite → bituminous → anthracite | Ancient tropical/subtropical wetlands; degree of metamorphism | US, China, India, Russia, Australia |
| Petroleum | Marine organic matter; kerogen maturation in the oil window (60–120 °C) | Sedimentary basins with source rock, reservoir, cap rock, and structural trap | Middle East (Saudi Arabia, Iraq, Iran), Venezuela, US, Russia |
| Natural Gas | Deeper thermal maturation of kerogen (gas window >120 °C); also biogenic methane | Similar to petroleum; often found in association with oil or in deep basins | Russia, Iran, Qatar, US, Turkmenistan |
| Uranium | Concentrated by hydrothermal and sedimentary processes in igneous/metamorphic terranes | Granitic intrusions, sandstone-hosted roll-front deposits | Kazakhstan, Canada, Australia, Namibia |
| Solar | Electromagnetic radiation from the sun | Latitude, cloud cover, altitude, atmospheric transparency | Sahara, Arabian Peninsula, SW US, Australia, Chile (Atacama) |
| Wind | Differential solar heating drives atmospheric circulation | Persistent wind corridors; land-sea boundaries; topographic funneling | US Great Plains, North Sea, Patagonia, Inner Mongolia |
| Hydroelectric | Gravitational potential energy of flowing water | Precipitation, topographic relief, river discharge | Brazil, China, Canada, Norway, US (Pacific NW) |
| Geothermal | Heat from radioactive decay and residual planetary accretion | Plate boundaries (subduction, rift zones); hot spots | Iceland, Philippines, Indonesia, Kenya, western US |
Major energy resources, their formation processes, and primary distribution factors
The distinction between stock resources (finite deposits formed over geological time) and flow resources (continuously replenished by solar, gravitational, or geothermal energy) is fundamental to understanding sustainability. A nation that depletes its stock resources cannot regenerate them on any human-relevant timescale, whereas a nation with abundant flow resources can harvest energy indefinitely—provided the infrastructure is in place.
SECTION 6
Worked Example: Comparing Hydroelectric Potential
To illustrate how physical geography determines energy resource potential, consider two hypothetical dam sites. Site A is located in a mountainous tropical region with high rainfall, while Site B is in a semi-arid plain with modest elevation change. We will calculate the theoretical power output at each site and discuss which factors most strongly influence the result.
Hydroelectric Power Comparison
- 1
Step 1 — Identify Given Values
Site A: flow rate Q = 500 m³/s, hydraulic head h = 80 m, turbine efficiency η = 0.90. Site B: flow rate Q = 120 m³/s, hydraulic head h = 15 m, turbine efficiency η = 0.85. - 2
Step 2 — Apply the Hydroelectric Power Equation
Using P = η × ρ × g × Q × h, with ρ = 1,000 kg/m³ and g = 9.8 m/s². - 3
Step 3 — Calculate Site A Power
P(A) = 0.90 × 1,000 × 9.8 × 500 × 80 = 0.90 × 392,000,000 = 352,800,000 WP(A) ≈ 353 MW - 4
Step 4 — Calculate Site B Power
P(B) = 0.85 × 1,000 × 9.8 × 120 × 15 = 0.85 × 17,640,000 = 14,994,000 WP(B) ≈ 15.0 MW - 5
Step 5 — Interpret the Results
Site A produces roughly 23.5 times more power than Site B. The dominant factors are the much greater flow rate (reflecting higher precipitation in a tropical watershed) and the larger hydraulic head (reflecting steeper mountain topography). This example demonstrates why nations like Brazil, Norway, and Canada—with mountainous terrain and abundant precipitation—dominate global hydroelectric production, while flat, arid regions have negligible hydroelectric potential regardless of investment.
SECTION 7
Advantages & Limitations of Energy Resource Types
No energy resource is universally superior. Each carries environmental, economic, and geographic trade-offs that influence which resources a nation develops. The table below compares the advantages and limitations of the major energy types, with particular attention to the factors that appear on the AP Environmental Science exam.
| Resource | Advantages | Limitations |
|---|---|---|
| Coal | Abundant; well-established infrastructure; high energy density; inexpensive in coal-rich nations | Highest CO₂ emissions per unit energy; SO₂ and particulate pollution; mountaintop removal and acid mine drainage |
| Petroleum | Very high energy density; versatile (fuels, plastics, chemicals); existing global distribution network | Geographically concentrated; oil spills; CO₂ emissions; price volatility; geopolitical conflict |
| Natural Gas | Lower CO₂ per unit energy than coal/oil; burns cleanly (less particulate); can complement renewables | Methane leakage (potent GHG); hydraulic fracturing impacts; requires pipeline/LNG infrastructure |
| Nuclear (Uranium) | Very low CO₂ during operation; extremely high energy density; reliable baseload power | Radioactive waste storage; accident risk; high capital costs; uranium mining impacts; long construction times |
| Solar | Zero emissions during operation; rapidly declining costs; scalable; suitable for distributed generation | Intermittent (no generation at night); land use for utility-scale; manufacturing requires rare minerals; storage needed |
| Wind | Zero emissions during operation; small land footprint per MW; offshore potential; cost-competitive | Intermittent; bird and bat mortality; visual/noise concerns; site-specific; requires grid upgrades |
| Hydroelectric | Low operating costs; long lifespan; provides water storage and flood control; dispatchable | Habitat disruption (river fragmentation); displaces communities; methane from reservoirs; drought vulnerability |
| Geothermal | Continuous baseload power; very low emissions; small surface footprint | Geographically limited to tectonic boundaries; high upfront drilling costs; potential for induced seismicity |
Comparison of advantages and limitations for major energy resources
KEY TAKEAWAY
SECTION 8
Geopolitical Implications & the Energy Transition
The uneven distribution of nonrenewable energy resources has been a primary driver of international trade, alliance formation, and armed conflict throughout the twentieth and twenty-first centuries. Nations with large petroleum reserves—particularly in the Persian Gulf—wield outsized influence over global energy markets, while net importers must manage supply-chain vulnerabilities. The concept of energy security captures a nation's ability to maintain reliable access to energy resources at affordable prices. The ongoing energy transition from fossil fuels to renewable sources is reshaping these dynamics by dispersing energy production potential more widely, though it introduces new dependencies on critical minerals such as lithium, cobalt, and rare-earth elements needed for batteries and turbines.
| Dimension | Fossil Fuel Era | Renewable Energy Era |
|---|---|---|
| Resource concentration | Highly concentrated in a few nations (OPEC holds ~80% of proved oil reserves) | More broadly distributed; every nation has some solar, wind, or hydro potential |
| Supply chain risk | Tanker routes, pipelines, and chokepoints (e.g., Strait of Hormuz) | Critical mineral supply chains (lithium from Chile/Australia; cobalt from DRC; rare earths from China) |
| Geopolitical leverage | Petrostates use oil revenues and export controls as political tools | Mineral-rich nations may gain new influence; technology leaders gain advantage |
| Environmental justice | Extraction impacts concentrated in developing regions; climate impacts global | Mining impacts shift to new regions; land-use conflicts emerge around renewables |
| Energy independence potential | Only feasible for resource-rich nations | Theoretically achievable for most nations with sufficient investment |
Comparing geopolitical dynamics of the fossil fuel era and the emerging renewable energy era
Looking forward, the AP Environmental Science curriculum emphasizes that the energy transition does not eliminate resource distribution issues—it transforms them. Nations that once depended on Middle Eastern oil may become dependent on Chinese rare-earth processing or Congolese cobalt mining. Understanding these shifting dynamics requires the same analytical framework applied to fossil fuels: identify where the resource is concentrated, trace the supply chain, and evaluate the environmental and social costs of extraction, refinement, and transport.
SECTION 9
Practice Problems
Question 1: CONCEPTUAL
- A. The Middle East has the highest rates of current biological productivity, which continuously generates new petroleum.
- B. Ancient marine organic matter accumulated in the Tethys Sea basin and was thermally matured within the oil window, forming large structural and stratigraphic traps.
- C. Tectonic activity along the Ring of Fire pushed petroleum from deep ocean trenches into Middle Eastern sedimentary formations.
- D. Desert climates promote the direct conversion of sand into hydrocarbon compounds through thermochemical reactions.
Show answer (B)
Question 2: BASIC CALCULATION
- A. 120 kWh/yr
- B. 200 kWh/yr
- C. 240 kWh/yr
- D. 1,200 kWh/yr
Show answer (C)
Question 3: INTERMEDIATE
- A. Iceland has a small population and therefore requires less total energy than most nations.
- B. Iceland sits on the Mid-Atlantic Ridge, providing exceptional geothermal heat flow, and receives abundant precipitation that feeds glacial rivers with steep topographic gradients.
- C. Iceland imports most of its fossil fuels from Norway, allowing it to reserve domestic generation for renewables.
- D. Iceland's high latitude provides exceptionally strong and consistent wind resources that supplement geothermal energy.
Show answer (B)
Question 4: APPLIED
4 ptsShow answer
Question 5: CRITICAL THINKING
4 ptsShow answer
SUMMARY
Summary: Distribution of Natural Energy Resources
Summary
The distribution of natural energy resources reflects the interplay of deep-time geological processes and present-day climatic and tectonic dynamics. Nonrenewable fossil fuels—coal, petroleum, and natural gas—are stock resources concentrated in ancient sedimentary basins where organic matter was buried, heated, and pressurized over millions of years. Their uneven distribution has driven geopolitical conflict, international trade networks, and the concept of energy security. Coal formed in Carboniferous swamp forests, petroleum matured in the oil window (60–120 °C), and natural gas forms at even higher temperatures in the gas window.
Renewable energy resources—solar, wind, hydroelectric, and geothermal—are flow resources continuously replenished by the sun, atmosphere, hydrological cycle, and Earth's internal heat. Solar potential depends on latitude and cloud cover (I = I₀ × cos θ); wind power scales with the cube of wind speed (P/A = ½ρv³); hydroelectric potential requires precipitation and topographic relief (P = ηρgQh); and geothermal energy concentrates at tectonic plate boundaries. The ongoing energy transition is shifting geographic power dynamics but introducing new dependencies on critical minerals, demonstrating that resource distribution challenges evolve rather than disappear.