

SECTION 1
Historical Context & Motivation
The realization that synthetic chemicals could travel through entire food webs—concentrating to dangerous levels in top predators—was one of the most consequential insights in twentieth-century environmental science. Before the 1950s, regulators assumed that diluting a contaminant in a large body of water rendered it harmless, because ambient concentrations were orders of magnitude below acute toxicity thresholds. That assumption proved catastrophically wrong when scientists discovered that organisms at the top of aquatic and terrestrial food chains were accumulating certain persistent organic pollutants (POPs) at concentrations millions of times higher than those found in surrounding water or soil. The ecological and human health consequences of this phenomenon reshaped pesticide regulation, catalyzed the modern environmental movement, and remain a central topic on the AP Environmental Science exam.
1939 • DDT Synthesized for Insect Control
1962 • Silent Spring Published
1972 • U.S. DDT Ban
2001 • Stockholm Convention on POPs
2017 • Minamata Convention Enters Force
This historical trajectory raises the central question that this lesson addresses: why do certain contaminants become more concentrated as they move from the environment into organisms, and then from lower trophic levels to higher ones? Understanding the mechanisms behind bioaccumulation and biomagnification is essential for predicting which pollutants pose the greatest ecological risk and for designing effective regulatory strategies.
SECTION 2
Core Principles & Definitions
Two closely related but distinct processes govern how pollutants concentrate in living systems. Although often confused on exams, each operates at a different scale and through a different mechanism; precise definitions are critical for earning full credit on both the multiple-choice and free-response sections of the AP Environmental Science exam.
Bioaccumulation
Biomagnification
Bioconcentration
Persistence & Lipophilicity
Trophic Transfer Efficiency
KEY TAKEAWAY
SECTION 3
Visual Explanation — The Food-Chain Amplification Model
Several features of this diagram deserve close attention. First, the water concentration of DDT is extraordinarily low—parts per trillion—yet the top predator carries concentrations in the parts-per-million range. This occurs because each organism ingests many contaminated prey items over its lifetime, and DDT's high lipophilicity means it is sequestered in adipose tissue rather than being metabolized or excreted efficiently. Second, the arrows point upward through the food chain, reinforcing that biomagnification is a trophic-level phenomenon: the contaminant increases in concentration at each step not because the predator is exposed to more contaminated water, but because it consumes many organisms that have themselves already bioaccumulated the pollutant.
SECTION 4
Mathematical Framework
While the AP Environmental Science exam rarely asks students to perform complex calculations involving bioaccumulation kinetics, a quantitative understanding of the key indices strengthens conceptual reasoning and is essential for free-response questions that involve data analysis. Two metrics are central: the bioconcentration factor (BCF) and the biomagnification factor (BMF).
BIOCONCENTRATION FACTOR
Where Corganism is the concentration of the contaminant in the organism's tissue (mg/kg) and Cwater is the concentration in the surrounding water (mg/L). A BCF > 1 indicates the organism concentrates the chemical above ambient levels; BCF > 5,000 is classified as highly bioaccumulative under EPA criteria.
BIOMAGNIFICATION FACTOR
Where Cpredator is the tissue concentration in the consumer and Cprey is the tissue concentration in its prey. A BMF > 1 confirms that the substance biomagnifies (i.e., its concentration increases from one trophic level to the next).
OVERALL MAGNIFICATION ACROSS n TROPHIC LEVELS
This simplified model assumes a constant BMF at each trophic step. Cn is the concentration at trophic level n, BCF accounts for the initial uptake by the producer from water, and BMF(n−1) accounts for successive trophic transfers. In reality, BMF varies between trophic steps.
The octanol-water partition coefficient (Kow) is a laboratory measurement that predicts a chemical's tendency to bioaccumulate. Kow quantifies how a chemical partitions between a lipophilic phase (octanol) and water; substances with log Kow > 5 are strongly lipophilic and highly likely to bioaccumulate. DDT, for instance, has a log Kow of approximately 6.9, explaining its extreme bioaccumulative potential.
SECTION 5
Key Pollutants That Bioaccumulate and Biomagnify
Not all pollutants bioaccumulate or biomagnify. The chemicals that pose the greatest risk share two properties: they are persistent (they resist degradation and remain in the environment for years to decades) and lipophilic (they dissolve readily in fats and oils, allowing them to be stored in adipose tissue rather than excreted in urine). The table below summarizes the most commonly tested pollutants on the APES exam and their ecological consequences.
| Pollutant | Class | Primary Source | Ecological Effect of Biomagnification |
|---|---|---|---|
| DDT / DDE | Organochlorine pesticide | Agricultural spraying; still used in some regions for malaria control | Eggshell thinning in raptors via disruption of calcium metabolism; population crashes in bald eagles, peregrine falcons, and brown pelicans |
| Mercury (as methylmercury) | Heavy metal | Coal combustion; artisanal gold mining; volcanic emissions | Neurotoxicity in fish-eating mammals and birds; developmental impairment in human fetuses (Minamata disease) |
| PCBs | Synthetic industrial chemical | Electrical transformers, coolants; legacy contamination in river sediments | Immune suppression, reproductive failure, and endocrine disruption in marine mammals such as orcas and beluga whales |
| PFAS | Per- and polyfluoroalkyl substances | Firefighting foam (AFFF), nonstick coatings, food packaging | Liver damage, immune suppression; sometimes called 'forever chemicals' because they resist virtually all forms of degradation |
| Lead | Heavy metal | Lead ammunition in hunting, legacy lead paint and gasoline, mining waste | Lead poisoning in scavengers such as California condors that consume carcasses with embedded lead shot fragments |
Major bioaccumulative pollutants tested on the APES exam
SECTION 6
Worked Example — Calculating Biomagnification
A lake ecosystem is contaminated with mercury. Scientists measure the following methylmercury concentrations: water = 0.001 ppm; phytoplankton = 0.5 ppm; zooplankton = 2.0 ppm; small fish = 8.0 ppm; large fish = 40.0 ppm; osprey = 200.0 ppm. Let us calculate several indices of bioaccumulation and biomagnification.
Mercury Biomagnification in a Lake Food Chain
- 1
Step 1 — Calculate the BCF for phytoplankton
BCF = Corganism / Cwater = 0.5 ppm / 0.001 ppmBCF = 500 — phytoplankton concentrate mercury 500× above ambient water levels. - 2
Step 2 — Calculate the BMF from zooplankton to small fish
BMF = Cpredator / Cprey = 8.0 ppm / 2.0 ppmBMF = 4 — small fish carry 4× the mercury concentration of zooplankton. - 3
Step 3 — Calculate the overall magnification factor from water to osprey
Overall magnification = Cosprey / Cwater = 200.0 ppm / 0.001 ppmOverall magnification = 200,000× — the osprey has mercury concentrations 200,000 times greater than the ambient water. - 4
Step 4 — Interpret ecological significance
Mercury concentrations above approximately 0.5 ppm in fish tissue trigger human health advisories, and concentrations above 20 ppm in bird tissue are associated with reproductive impairment. At 200 ppm, the osprey is well above the threshold for severe neurological and reproductive effects. This illustrates why even trace-level mercury contamination in water bodies can produce lethal concentrations in top predators through biomagnification.
SECTION 7
Factors Influencing Bioaccumulation — and Model Limitations
The simplified equations presented in Section 4 assume uniform BMF values across trophic levels and stable environmental conditions, but real ecosystems introduce substantial complexity. Several biological, chemical, and ecological factors influence the degree to which a contaminant accumulates and magnifies. Understanding these factors helps explain why bioaccumulation is not a fixed property of a chemical but rather an emergent outcome of organism–environment interactions.
| Factor | Effect on Bioaccumulation | Limitation of Simple Models |
|---|---|---|
| Metabolic rate | Organisms with higher metabolic rates may excrete contaminants faster, reducing bioaccumulation. Warm-blooded species often have lower BCFs for some compounds than cold-blooded ones. | Constant-BMF models ignore species-specific metabolism |
| Organism age & body size | Older and larger organisms have longer exposure histories, so they tend to carry higher body burdens of persistent pollutants. | Models assume steady-state rather than time-dependent accumulation |
| Lipid content | Species with higher body-fat percentages store more lipophilic pollutants. Marine mammals such as orcas and polar bears carry extremely high pollutant loads due to thick blubber layers. | Simple models do not normalize concentrations to lipid weight |
| Food-web complexity | Organisms that feed at multiple trophic levels (omnivores) or that shift diet seasonally complicate the linear-chain model of biomagnification. | Linear food-chain models oversimplify real food webs |
| Chemical speciation | The chemical form matters: inorganic mercury is relatively poorly absorbed, while methylmercury (produced by anaerobic bacteria) is efficiently absorbed and highly biomagnified. | Models that treat all forms of a metal as equivalent miss critical differences in bioavailability |
Factors influencing bioaccumulation and limitations of simplified models
KEY TAKEAWAY
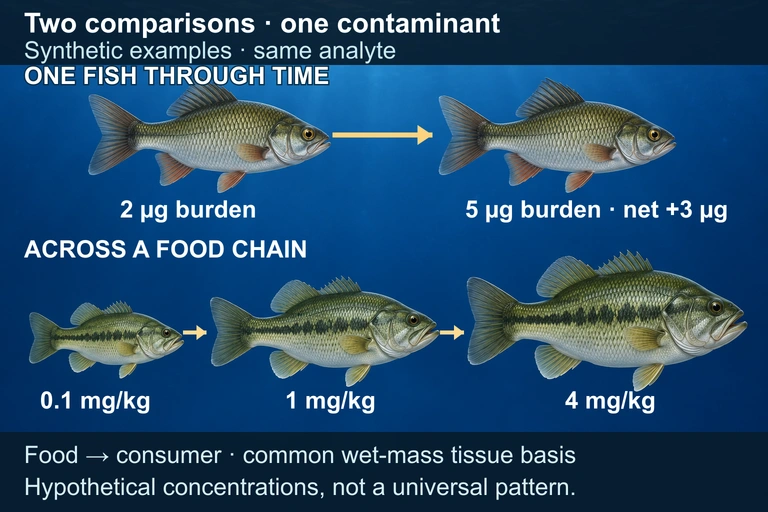 Bioaccumulation tracks uptake and loss within an organism over time. Biomagnification compares tissue concentrations across feeding relationships on a common measurement basis.
SECTION 8
Policy Responses & Advanced Connections
Understanding bioaccumulation and biomagnification has driven some of the most significant environmental policies of the past half-century. Because the consequences of these processes are often separated in time and space from the point of contamination, regulatory frameworks must be proactive rather than reactive. This section connects the scientific concepts to the policy tools most commonly addressed on the APES exam and in college-level environmental science courses.
| Policy / Regulation | Mechanism | Connection to Bioaccumulation / Biomagnification |
|---|---|---|
| Stockholm Convention (2001) | International treaty banning or restricting POPs | Targets chemicals specifically because they are persistent, bioaccumulative, toxic, and capable of long-range transport |
| Clean Water Act (1972) | Sets effluent limits and water quality criteria for toxic pollutants | Water quality criteria for bioaccumulative pollutants (e.g., mercury) are set far lower than acute toxicity thresholds to account for food-chain amplification |
| EPA Fish Consumption Advisories | Informs public about mercury and PCB levels in locally caught fish | Advisories directly address human exposure to biomagnified contaminants via dietary intake of top-predator fish (tuna, swordfish, bass) |
| Minamata Convention (2013/2017) | International treaty phasing down mercury use and emissions | Named after Minamata Bay disaster where methylmercury biomagnification caused mass neurological poisoning; directly motivated by food-chain concentration |
| Bioremediation & Phytoremediation | Uses organisms (bacteria, plants) to extract or degrade contaminants | Plants that hyperaccumulate heavy metals can be used to remove contaminants from soil, exploiting bioaccumulation as a remediation tool rather than a hazard |
Key policies addressing bioaccumulation and biomagnification
Looking forward, the emergence of PFAS contamination represents a new frontier in bioaccumulation science. Unlike the classic lipophilic POPs, some PFAS compounds are both hydrophobic and oleophobic, binding to proteins rather than lipids, which challenges traditional BCF models calibrated to lipid partitioning. Additionally, microplastics are increasingly recognized as vectors for bioaccumulative contaminants: persistent organic pollutants adsorb onto microplastic surfaces and may be released during digestion, potentially increasing the bioavailability of toxicants to marine organisms. These evolving challenges ensure that bioaccumulation and biomagnification will remain at the forefront of environmental science for decades to come.
SECTION 9
Practice Problems
Question 1: CONCEPTUAL
- A. Tertiary consumers have the fastest metabolic rates, so they absorb more of the pesticide from water.
- B. The pesticide is water-soluble and is concentrated by the kidneys of higher-level consumers.
- C. Each consumer ingests many prey organisms that have already bioaccumulated the persistent, lipophilic pesticide, so the concentration increases at each trophic level.
- D. Producers actively pump the pesticide out of their cells, making them appear to have lower concentrations.
Show answer (C)
Question 2: BASIC CALCULATION
- A. 500
- B. 2,500
- C. 5
- D. 0.2
Show answer (C)
Question 3: INTERMEDIATE
- A. Lake A, because shorter food chains concentrate pollutants more efficiently
- B. Lake B, because more trophic levels provide more opportunities for biomagnification
- C. Both lakes would have equal mercury in top predators because the dissolved mercury concentration is the same
- D. Lake A, because bass in a shorter food chain eat more total prey over their lifetime
Show answer (B)
Question 4: APPLIED
4 ptsShow answer
Question 5: CRITICAL THINKING
4 ptsShow answer
SUMMARY
Summary
Summary
Bioaccumulation is the process by which an individual organism accumulates a contaminant in its tissues over time because uptake exceeds excretion and metabolic breakdown. Biomagnification extends this phenomenon across trophic levels: because each predator consumes many contaminated prey items, tissue concentrations increase progressively up the food chain. The chemicals most susceptible to these processes are persistent (resistant to degradation) and lipophilic (fat-soluble), such as DDT, PCBs, methylmercury, and PFAS.
Quantitatively, the bioconcentration factor (BCF) measures the ratio of tissue concentration to water concentration, while the biomagnification factor (BMF) measures the increase from prey to predator. Key factors that influence these processes include organism metabolic rate, body lipid content, food-chain length, and the chemical speciation of the contaminant. Policy responses—from Rachel Carson's Silent Spring to the Stockholm Convention and Minamata Convention—have directly targeted bioaccumulative pollutants, and understanding these mechanisms is essential for evaluating both the ecological impacts of contamination and the design of effective remediation strategies.