

SECTION 1
Historical Context & Motivation
Long before scientists formalized the concept of a biome, coastal and riverine communities understood that water bodies differ dramatically in the life they support. Greek natural philosophers such as Aristotle cataloged marine organisms by habitat zone, while Polynesian navigators recognized distinct pelagic provinces based on current patterns and species assemblages. The modern study of aquatic biomes emerged as limnology and oceanography matured into rigorous disciplines during the nineteenth and twentieth centuries, driven by the need to understand fisheries, water quality, and global biogeochemical cycling.
1872 • HMS Challenger Expedition
1935 • Tansley Coins 'Ecosystem'
1953 • Odum's Energy-Flow Studies
1975 • Whittaker's Biome Classification
2005 • Millennium Ecosystem Assessment
These milestones reveal a persistent question that still guides AP Environmental Science: what abiotic factors determine which organisms thrive in a given body of water, and how do human activities alter those factors? Answering that question requires a systematic classification of Earth's aquatic environments—freshwater, marine, and the transitional zones that bridge them.
SECTION 2
Core Principles & Definitions
Aquatic biomes are classified primarily by salinity (freshwater < 0.5 ppt; marine ~35 ppt; brackish in between) and secondarily by physical characteristics such as depth, light availability, flow rate, and temperature. Unlike terrestrial biomes, which are defined largely by temperature and precipitation, aquatic biomes depend on the chemical and physical properties of water itself—its high specific heat, density behavior, and capacity to dissolve gases and nutrients.
Salinity Gradient
Photic vs. Aphotic Zones
Lentic vs. Lotic
Dissolved Oxygen & Nutrients
Benthic vs. Pelagic
SECTION 3
Visual Explanation — Aquatic Biome Zonation
The diagram illustrates the vertical structure of the open ocean, the single largest biome on Earth by area. Notice that light penetration controls the fundamental division: only the upper photic zone receives enough photosynthetically active radiation (PAR) to support primary producers like phytoplankton and macroalgae. Below the aphotic zone threshold (~200 m), organisms depend on sinking organic matter—sometimes called marine snow—or on chemosynthetic bacteria near hydrothermal vents. Horizontally, the neritic zone overlying the continental shelf supports higher productivity due to nutrient runoff and upwelling, while the oceanic zone is nutrient-poor but vast.
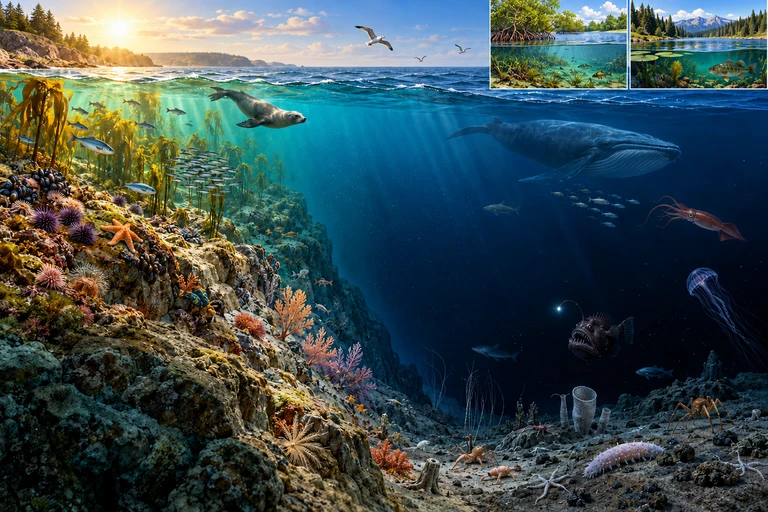 Nearshore and offshore describe horizontal position; photic and aphotic describe light conditions. Benthic habitat is the seafloor at any depth.
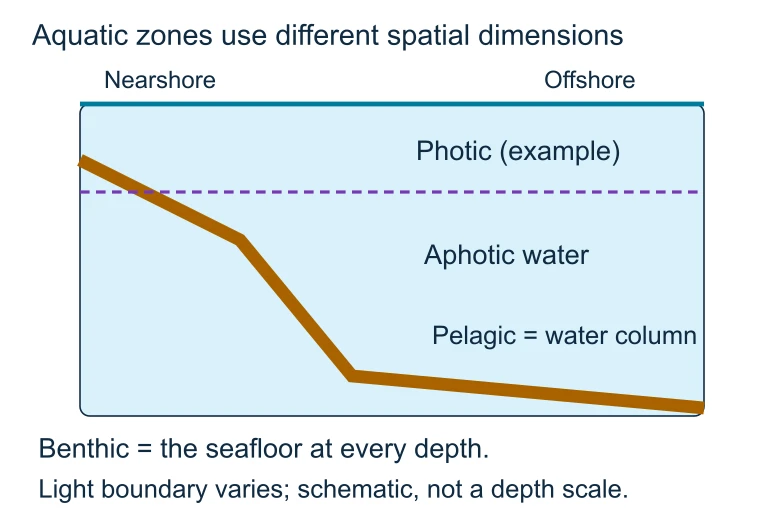 Nearshore and offshore describe horizontal position; photic and aphotic describe light conditions. Benthic habitat is the seafloor at any depth.
SECTION 4
How Abiotic Factors Shape Aquatic Biomes
Thermal Stratification in Lakes
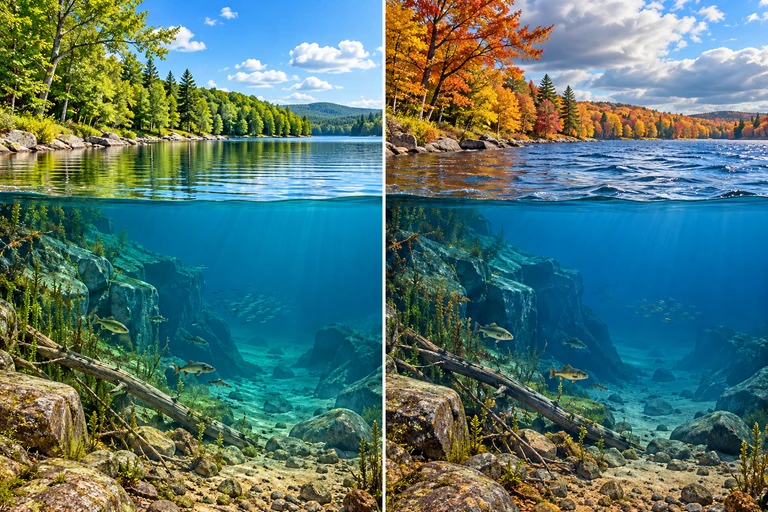
Temperature exerts profound control over aquatic ecosystems. In temperate lakes, solar heating warms the surface layer (epilimnion) while deeper water (hypolimnion) remains cold and dense. Separating them is the thermocline (or metalimnion), a narrow zone of rapid temperature change. This thermal stratification restricts vertical mixing and traps nutrients in the hypolimnion during summer. Twice a year—in spring and autumn—surface temperatures converge with bottom temperatures, erasing the density gradient and allowing full-lake turnover that redistributes dissolved oxygen and nutrients. This mixing pulse drives seasonal algal blooms and is a defining feature of dimictic lakes.
Net Primary Productivity in Aquatic Systems
NET PRIMARY PRODUCTIVITY
NPP = net primary productivity (g C m⁻² yr⁻¹); GPP = gross primary productivity; R = autotroph respiration. In aquatic biomes, NPP is strongly limited by light and nutrient availability.
LIGHT ATTENUATION (BEER–LAMBERT LAW)
I(z) = light intensity at depth z; I₀ = surface irradiance; k = attenuation coefficient (m⁻¹), which increases with turbidity and dissolved organic matter; z = depth (m). The photic zone ends where I(z) ≈ 1% of I₀.
The Beer–Lambert relationship explains why turbid estuaries have shallow photic zones while clear oligotrophic lakes allow light to penetrate much deeper. A high k value—caused by suspended sediment, algal cells, or dissolved organics—collapses the photic zone and limits where photosynthesis can occur. This directly links water clarity to ecosystem productivity and biome classification.
Salinity & Osmotic Stress
Salinity determines organism distribution more than almost any other single factor. Freshwater organisms maintain internal ion concentrations higher than their surroundings and must actively excrete excess water, while marine species face the opposite osmotic challenge. Species adapted to estuarine conditions (euryhaline species) possess specialized ion-transport mechanisms, but most aquatic organisms are stenohaline—tolerant of only a narrow salinity range. This physiological constraint is why the freshwater–marine boundary constitutes a major biogeographic barrier.
 The summer profile has warm surface water above colder deep water. In autumn, a weaker density difference allows mixing when sufficient wind energy is available.
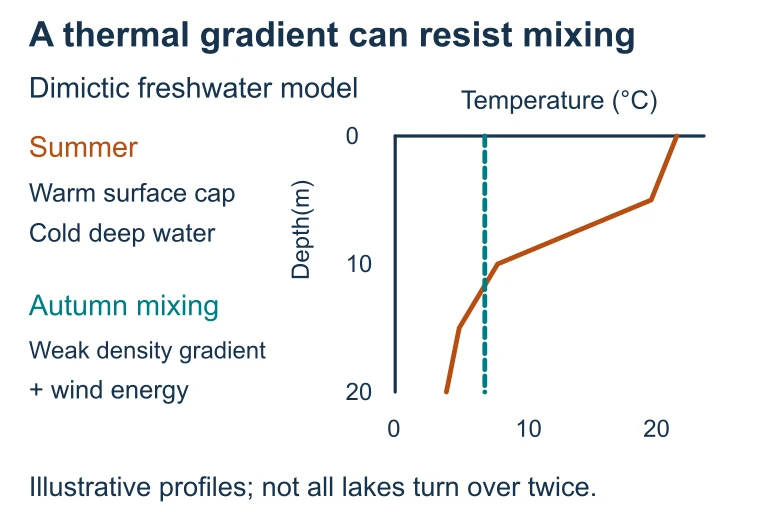 The summer profile has warm surface water above colder deep water. In autumn, a weaker density difference allows mixing when sufficient wind energy is available.
SECTION 5
Freshwater, Marine & Transitional Biomes
| Biome Type | Key Abiotic Factors | Dominant Producers | Relative NPP |
|---|---|---|---|
| Oligotrophic Lake | Low nutrients, clear water, deep photic zone | Sparse phytoplankton, littoral macrophytes | Low |
| Eutrophic Lake | High nutrients, turbid, shallow photic zone | Dense phytoplankton, cyanobacteria blooms | High |
| River / Stream | Flow velocity, dissolved O₂, substrate | Periphyton, riparian inputs (allochthonous) | Low–Moderate |
| Estuary | Fluctuating salinity, tidal mixing, sediment load | Salt-tolerant grasses, phytoplankton, algae | Very High |
| Coral Reef | Warm (23–29 °C), clear, shallow, high light | Zooxanthellae (symbiotic dinoflagellates) | Very High |
| Open Ocean | Nutrient-poor surface, vast area, deep | Phytoplankton (diatoms, coccolithophores) | Low per m², huge total |
Comparison of major aquatic biome types by abiotic factors, producers, and productivity
SECTION 6
Worked Example — Photic Zone Depth & Eutrophication
A common AP Environmental Science task requires students to connect anthropogenic nutrient loading to changes in aquatic biome structure. The following worked example uses the Beer–Lambert light-attenuation model to show how eutrophication shrinks the photic zone.
Worked example
- 1
Step 1 — Identify Given Values
A clear oligotrophic lake has an attenuation coefficient k = 0.05 m⁻¹. After years of agricultural runoff, algal growth increases turbidity and k rises to 0.20 m⁻¹. Surface irradiance I₀ = 1 000 µmol photons m⁻² s⁻¹. The photic zone ends where I(z) = 1% of I₀ = 10 µmol photons m⁻² s⁻¹. - 2
Step 2 — Apply Beer–Lambert Law (Before Runoff)
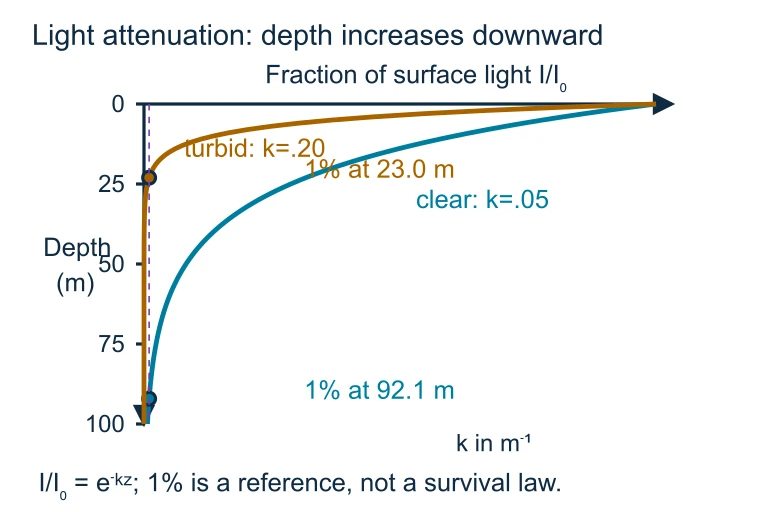
Set I(z) = 0.01 × I₀ and solve for z: 0.01 = . Taking the natural log: ln(0.01) = −0.05z → −4.605 = −0.05z → z = 92.1 m.Photic zone (before) ≈ 92 m - 3
Step 3 — Apply Beer–Lambert Law (After Runoff)
With k = 0.20 m⁻¹: ln(0.01) = −0.20z → −4.605 = −0.20z → z = 23.0 m.Photic zone (after) ≈ 23 m - 4
Step 4 — Interpret Ecological Impact
The photic zone shrank by about 75%—from 92 m to 23 m. This means photosynthesis is now confined to the upper quarter of the water column. Submerged aquatic vegetation (SAV) on the lake bottom below 23 m will die, benthic oxygen demand will increase as dead plant material decomposes, and the lake may shift from an oligotrophic to a eutrophic state with hypoxic bottom waters.Eutrophication reduces photic zone depth → loss of SAV → potential hypoxia
 Using the stated light-attenuation model, the 1% surface-light reference occurs at 92.1 m when k = 0.05 m⁻¹ and 23.0 m when k = 0.20 m⁻¹. Light requirements vary among organisms.
 Using the stated light-attenuation model, the 1% surface-light reference occurs at 92.1 m when k = 0.05 m⁻¹ and 23.0 m when k = 0.20 m⁻¹. Light requirements vary among organisms.
SECTION 7
Ecosystem Services & Threats
| Aquatic Biome | Key Ecosystem Services | Primary Threats |
|---|---|---|
| Freshwater Wetlands | Flood mitigation, water filtration, carbon storage, nursery habitat | Draining for agriculture, urban development, invasive species |
| Rivers & Streams | Drinking water, irrigation, sediment transport, recreation | Damming, channelization, pollution, water diversion |
| Estuaries | Fisheries nursery (>75% of commercial species), nutrient cycling | Nutrient loading, coastal development, hypoxic dead zones |
| Coral Reefs | Biodiversity hotspot, coastal protection, tourism, fisheries | Ocean warming (bleaching), acidification, sedimentation, overfishing |
| Open Ocean | O₂ production (~50% of global), CO₂ absorption, fisheries, climate regulation | Overfishing, plastic pollution, ocean acidification, deoxygenation |
Ecosystem services and anthropogenic threats for major aquatic biomes
SECTION 8
Connections to Global Environmental Issues
Aquatic biomes do not exist in isolation; they are embedded within the larger Earth system and are affected by, and contribute to, global environmental challenges studied throughout the AP Environmental Science curriculum. Understanding these connections is essential for FRQ responses that require you to trace cause-and-effect chains across multiple units.
| Concept in This Lesson | Connection to Broader APES Topic |
|---|---|
| Eutrophication & hypoxic zones | Unit 8: Nutrient pollution from agriculture; Gulf of Mexico dead zone; Clean Water Act |
| Coral bleaching | Unit 9: Climate change; ocean warming; CO₂ → carbonic acid → lower pH |
| Wetland loss | Unit 5: Land use change; loss of carbon sinks; flood risk increases |
| Thermohaline circulation | Unit 4: Global water cycle; heat transport; climate regulation |
| Invasive species in freshwater | Unit 2: Biodiversity; zebra mussels; trophic cascades |
SECTION 9
Practice Problems
Question 1: CONCEPTUAL
- A. Estuaries have constant salinity levels that reduce osmotic stress for all organisms.
- B. Tidal mixing and nutrient inputs from rivers provide abundant nutrients in shallow, sunlit water.
- C. Estuaries are located in tropical latitudes where temperatures are always optimal for photosynthesis.
- D. The deep water columns in estuaries allow phytoplankton to photosynthesize at many depth levels.
Show answer (B)
Question 2: BASIC CALCULATION
- A. 23 m
- B. 46 m
- C. 92 m
- D. 10 m
Show answer (B)
Question 3: INTERMEDIATE
- A. Warm epilimnion → thermocline forms → hypolimnion isolated → decomposition depletes O₂ → potential hypoxia
- B. Cold epilimnion → thermocline breaks down → hypolimnion mixes freely → O₂ increases throughout
- C. Warm hypolimnion → density decreases → water rises → lake mixes continuously in summer
- D. Thermocline deepens → hypolimnion receives more sunlight → photosynthesis increases → O₂ rises
Show answer (A)
Question 4: APPLIED
Show answer
Question 5: CRITICAL THINKING