

SECTION 1
Historical Context & Motivation
Humans have cultivated aquatic organisms for millennia, yet aquaculture—the controlled breeding, rearing, and harvesting of fish, shellfish, algae, and other aquatic species—has only recently become a dominant force in the global food supply. As wild-capture fisheries peaked in the late twentieth century and many stocks entered decline due to overharvesting, aquaculture emerged as a seemingly logical alternative. Today it supplies more than half of all fish consumed by humans, making it the fastest-growing food-production sector on the planet. Understanding its origins reveals both the promise and the persistent environmental trade-offs that define modern aquaculture practice.
~2500 BCE • Ancient Chinese Carp Ponds
1853 • First U.S. Fish Hatchery
1970s • Norwegian Salmon Farming Begins
2013 • Aquaculture Surpasses Wild Catch for Human Food
2020s • Sustainability Innovations
The central question driving contemporary debate is whether aquaculture can supply a growing global population with affordable protein while minimizing habitat destruction, water pollution, and biodiversity loss—or whether it simply transfers the environmental costs of food production from one ecosystem to another.
SECTION 2
Core Principles & Definitions
To analyze aquaculture on the AP Environmental Science exam, you need to command a set of foundational concepts that span ecology, economics, and resource management. The cards below distill the most essential principles; together they form the conceptual backbone of every aquaculture-related question you will encounter.
Mariculture vs. Freshwater Aquaculture
Feed Conversion Ratio (FCR)
Nutrient Loading & Eutrophication
Biological Amplification of Disease
Genetic Pollution from Escapees
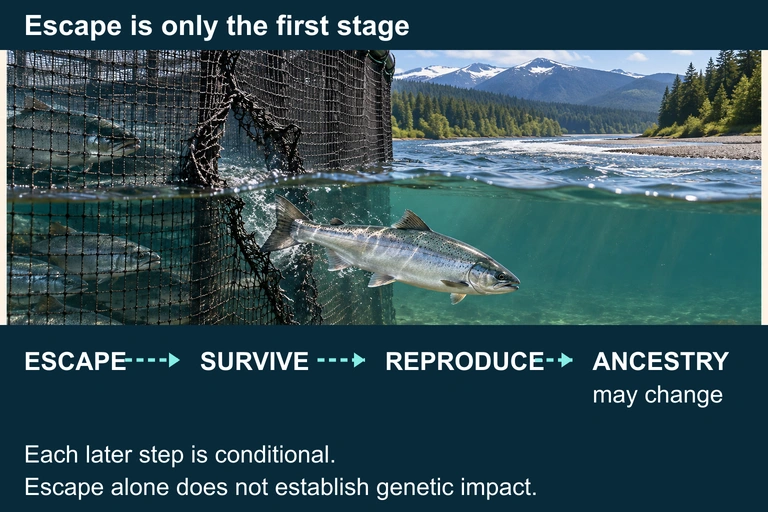 An escaped farm fish must survive and reproduce before it can contribute ancestry to a wild population. Interbreeding and changes in local adaptation are possible outcomes rather than automatic consequences of escape.
SECTION 3
Visual Explanation — Aquaculture Systems Overview
The diagram highlights a fundamental trade-off in aquaculture design: systems that minimize capital and energy costs (open net pens) externalize waste into the environment, while systems that internalize waste treatment (RAS) demand substantial energy and infrastructure investment. Inland ponds represent a middle ground, offering moderate cost and moderate environmental impact. On the AP exam, you should be prepared to evaluate which system type is most appropriate for a given ecological and economic context, recognizing that no single approach eliminates all environmental trade-offs.
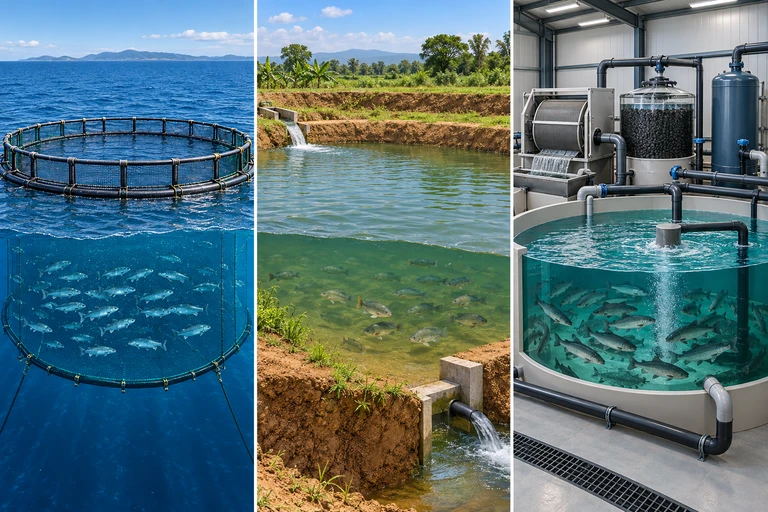 Open pens exchange water with the sea. Pond effluent depends on management, while recirculating systems capture solids and use biofiltration. Recirculation still requires makeup water, energy and waste handling.
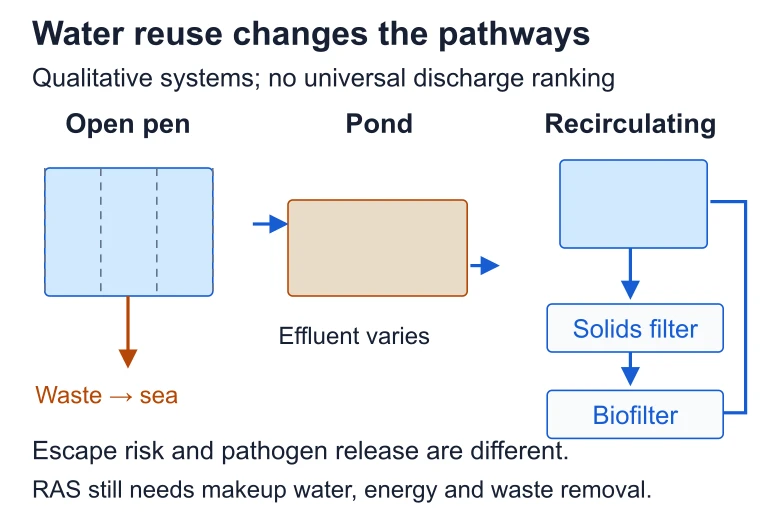 Open pens exchange water with the sea. Pond effluent depends on management, while recirculating systems capture solids and use biofiltration. Recirculation still requires makeup water, energy and waste handling.
SECTION 4
How Aquaculture Works — Ecological & Economic Mechanisms
Feed Conversion Ratio (FCR)
FEED CONVERSION RATIO
A lower FCR means greater efficiency. Salmon ≈ 1.2, chicken ≈ 1.8, pork ≈ 3.5, beef ≈ 6–8. Fish achieve low FCRs because they are ectothermic (do not expend energy maintaining body temperature) and are supported by buoyancy, saving muscular energy.
Nutrient Loading Rate
NITROGEN LOADING
The nitrogen not incorporated into harvestable biomass enters the surrounding water as dissolved ammonia or particulate organic nitrogen. Phosphorus loading follows an analogous equation. Reducing FCR simultaneously reduces nutrient loading per unit of product.
Fish-In Fish-Out Ratio (FIFO)
FISH-IN FISH-OUT RATIO
Carnivorous species like salmon historically had FIFO > 3, meaning more wild fish were consumed as feed than farmed fish were produced—a net protein loss. Advances in plant-based and insect-based feeds have reduced this ratio toward 1.0 or below for some species, a critical sustainability benchmark.
These three quantitative relationships—FCR, nutrient loading, and FIFO—are the metrics most frequently tested on the AP exam. They connect aquaculture to broader APES themes: energy transfer efficiency across trophic levels, eutrophication, and the sustainability of resource inputs. When a question asks you to evaluate the environmental impact of a fish farm, these ratios provide the analytical framework.
SECTION 5
Environmental Impacts — A Detailed Breakdown
The diagram above traces five major pathways by which open net-pen aquaculture degrades surrounding ecosystems. Nutrient pollution from fish excreta and uneaten feed triggers eutrophication in coastal waters. Genetic pollution occurs when farmed fish escape and interbreed with wild stocks, reducing genetic diversity and local adaptation. Disease and parasites proliferate in crowded pens and can devastate passing wild populations. Routine prophylactic use of antibiotics accelerates antibiotic resistance in marine bacteria. Finally, coastal aquaculture—particularly tropical shrimp farming—has driven extensive mangrove deforestation, eliminating nursery habitat for wild fisheries and removing a vital carbon sink.
SECTION 6
Worked Example — Calculating Nutrient Output
The following problem mirrors the calculation-based FRQ you may encounter on the AP exam. It integrates FCR and nitrogen loading to evaluate the environmental footprint of a hypothetical salmon farm.
Worked example
- 1
Step 1 — Identify Given Values
A salmon farm produces 500,000 kg of salmon per year. The FCR is 1.3. The feed contains 7% nitrogen by mass. Harvested salmon contain 3% nitrogen by mass. - 2
Step 2 — Calculate Total Feed Input
Feed input = FCR × Production = 1.3 × 500,000 kgFeed input = 650,000 kg/yr - 3
Step 3 — Calculate Nitrogen In (from feed)
N in feed = 650,000 kg × 0.07N_in = 45,500 kg N/yr - 4
Step 4 — Calculate Nitrogen Out (in harvested fish)
N in harvest = 500,000 kg × 0.03N_harvested = 15,000 kg N/yr - 5
Step 5 — Calculate Nitrogen Discharged to Environment
N discharged = N_in − N_harvested = 45,500 − 15,000N discharged = 30,500 kg N/yr released into surrounding waters - 6
Step 6 — Interpret the Result
Approximately 67% of all nitrogen entering the system as feed is discharged as waste. This nitrogen enters coastal waters as dissolved ammonia and particulate organic nitrogen, potentially driving eutrophication and hypoxia in the receiving environment. An FRQ answer should connect this calculation to the broader concept of nutrient loading and suggest mitigation strategies such as reducing FCR, using lower-protein feeds, or transitioning to a recirculating system.
SECTION 7
Benefits, Drawbacks & Comparisons
| Criterion | Aquaculture (Advantage) | Aquaculture (Disadvantage) |
|---|---|---|
| Protein efficiency | Low FCR compared to terrestrial livestock; less feed per kg of protein produced | Carnivorous species still depend on wild fish for feed ingredients (FIFO > 1) |
| Pressure on wild stocks | Can reduce fishing pressure if aquaculture replaces wild harvest | May increase pressure when fishmeal/oil is sourced from wild forage fish |
| Water quality | RAS and IMTA systems can filter and reuse water, minimizing discharge | Open systems release excess N and P, driving eutrophication |
| Biodiversity | Herbivorous species (tilapia, carp) can be raised sustainably with plant-based feeds | Escapees, disease spillover, and habitat conversion reduce wild biodiversity |
| Land / habitat use | Marine net pens and RAS use minimal terrestrial land | Coastal shrimp farms destroy mangrove forests at alarming rates |
Key trade-offs in aquaculture sustainability
SECTION 8
Sustainable Innovations & Future Directions
Cutting-edge approaches seek to reconcile high productivity with low environmental impact. Two innovations appear most frequently in AP-level discussions and are worth understanding in detail.
| Feature | Integrated Multi-Trophic Aquaculture (IMTA) | Recirculating Aquaculture Systems (RAS) |
|---|---|---|
| Concept | Co-culture of fed species (salmon), extractive species (mussels), and seaweed at multiple trophic levels to recycle waste nutrients | Land-based closed-loop tanks with mechanical/biological filtration and UV sterilization that recirculate 90–99% of water |
| Nutrient management | Shellfish filter particulate waste; seaweed absorbs dissolved N and P—mimicking natural nutrient cycling | Biofilters convert ammonia to nitrate; solids are physically removed and can be composted |
| Escapee risk | Moderate—still uses open-water cages for the fed species | Virtually zero—fully enclosed system |
| Energy demand | Low—relies on natural water flow | High—pumps, heaters, and UV sterilizers require significant electricity |
| AP relevance | Tested as an example of ecosystem-based management and biomimicry | Tested as a technological solution that shifts the pollution problem to an energy problem |
Comparison of two leading sustainable aquaculture innovations
Both IMTA and RAS illustrate a recurring theme in environmental science: solving one environmental problem often creates or shifts another. IMTA reduces nutrient loading but does not eliminate escapee risk. RAS eliminates most water-quality and escapee concerns but introduces a substantial carbon footprint unless powered by renewable energy. On the AP exam, these nuances matter; simplistic answers that frame any technology as a silver bullet will not earn full credit.
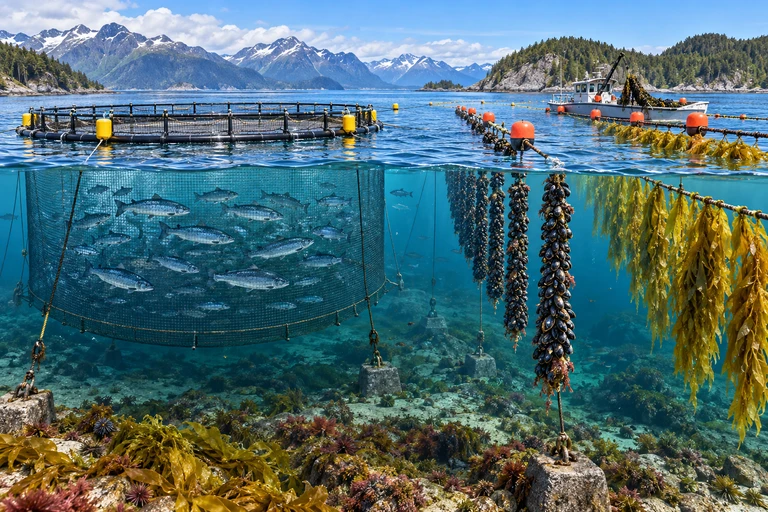 Fed fish release particulate organic matter and dissolved nutrients. Shellfish and seaweed recover different forms of material, so their placement and growth determine how much is retained in harvested biomass.
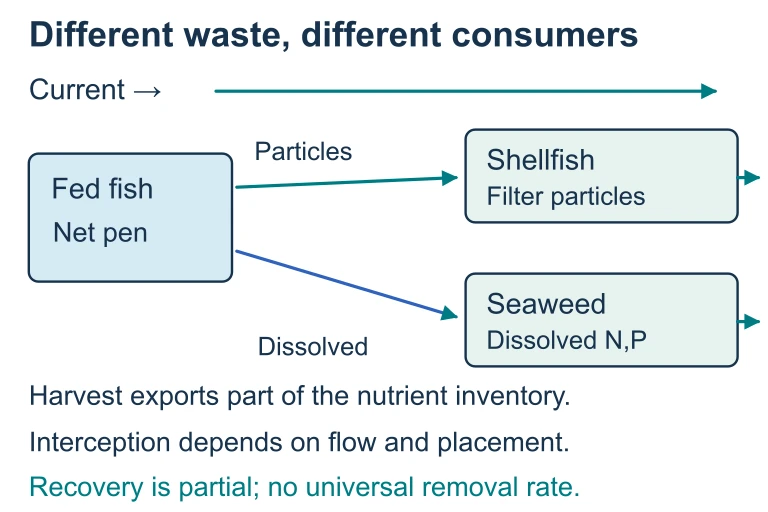 Fed fish release particulate organic matter and dissolved nutrients. Shellfish and seaweed recover different forms of material, so their placement and growth determine how much is retained in harvested biomass.
SECTION 9
Practice Problems
Question 1: CONCEPTUAL
- A. Fish are autotrophs and produce some of their own food through chemosynthesis.
- B. Fish are ectothermic and neutrally buoyant, so they spend less energy on thermoregulation and supporting their body weight.
- C. Fish feed contains a higher percentage of carbohydrates than cattle feed, providing more energy per kilogram.
- D. Fish are raised at higher trophic levels, giving them access to more concentrated energy sources.
Show answer (B)
Question 2: BASIC CALCULATION
- A. 125,000 kg
- B. 200,000 kg
- C. 320,000 kg
- D. 500,000 kg
Show answer (C)
Question 3: INTERMEDIATE
- A. Increased biodiversity due to the introduction of a new aquatic habitat
- B. Decreased coastal storm protection and loss of nursery habitat for wild marine species
- C. Reduced nutrient loading in coastal waters because shrimp consume excess algae
- D. Improved carbon sequestration because shrimp ponds store more organic matter than mangroves
Show answer (B)
Question 4: APPLIED
Show answer
Question 5: CRITICAL THINKING