

SECTION 1
Historical Context & Motivation
Understanding how many individuals occupy each age group in a population has been a central concern of governments and scientists for centuries. Early census-takers in ancient Rome and China counted heads primarily for taxation and military conscription, but it was not until the eighteenth and nineteenth centuries that scholars began systematically organizing population data by age. The intellectual foundation for modern age structure diagrams—also called population pyramids—emerged from the interplay between demography, public health, and environmental science, eventually becoming one of the most powerful tools for predicting whether a population will grow, stabilize, or shrink.
1798 • Malthus and Population Theory
1874 • The First Population Pyramid
1929 • Warren Thompson's Demographic Transition
1968 • Ehrlich's The Population Bomb
2000s–Present • Digital Demographic Modeling
The core question that age structure diagrams address is deceptively simple: given the current distribution of individuals across age classes, what trajectory is a population on? A country where the majority of individuals are of pre-reproductive age faces a fundamentally different future from one dominated by post-reproductive individuals. These diagrams translate raw census numbers into an instantly interpretable visual snapshot, enabling environmental scientists to assess pressures on resources, infrastructure, and ecosystems long before those pressures fully materialize.
SECTION 2
Core Principles & Definitions
An age structure diagram divides a population into horizontal bars representing age cohorts—typically five-year intervals—stacked vertically from youngest at the bottom to oldest at the top. Males are conventionally shown on the left side of a central vertical axis, and females on the right. The width of each bar represents either the absolute number or the percentage of the total population in that cohort. By examining the overall shape of the diagram, demographers and environmental scientists can classify a population's growth trajectory into one of three broad categories: rapid growth, slow or zero growth, and negative growth (decline).
Pre-Reproductive Age Class
Reproductive Age Class
Post-Reproductive Age Class
Replacement-Level Fertility
Demographic Transition Model (DTM)
KEY TAKEAWAY
SECTION 3
Visual Explanation — Reading a Population Pyramid
The shape of the diagram is the most important feature to interpret. A triangular (pyramidal) shape indicates rapid growth: each successive younger cohort is larger than the one above it, meaning the population has high birth rates and relatively high death rates. This shape is associated with Stage 2 of the Demographic Transition Model, where death rates have begun to fall but birth rates remain elevated. A columnar (rectangular) shape suggests slow or zero growth—cohorts are approximately equal in size through the reproductive years, with tapering only at older ages. This corresponds to Stage 3 or early Stage 4, where birth rates approach replacement level. Finally, an inverted or urn-shaped diagram—narrower at the base than in the middle—signals negative growth or population decline, as seen in late Stage 4 or Stage 5 of the DTM, where fertility has dropped well below replacement level.
AP Exam Tip
SECTION 4
Mathematical Framework
While age structure diagrams are primarily visual tools, several quantitative measures are derived from or related to the data they display. These calculations appear regularly on the AP Environmental Science exam and form the mathematical backbone for interpreting population dynamics.
RATE OF NATURAL INCREASE (r)
Where CBR = crude birth rate (births per 1,000 people per year), CDR = crude death rate (deaths per 1,000 people per year). Dividing by 10 converts the result to a percentage. A positive r indicates growth; a negative r indicates decline.
DOUBLING TIME (Rule of 70)
Where t₂ = doubling time in years and r = annual growth rate expressed as a percentage. For a country growing at 2.5% per year, t₂ = 70 / 2.5 = 28 years. Age structure diagrams with broad bases correspond to short doubling times.
TOTAL FERTILITY RATE (TFR)
Where ASFRx = age-specific fertility rate for each five-year cohort x (ages 15–19, 20–24, … , 45–49). TFR represents the average number of children a woman would bear over her lifetime at current fertility rates. The shape of the pyramid's base is largely determined by TFR.
DEPENDENCY RATIO
The dependency ratio expresses the number of dependents (young and elderly) per 100 working-age individuals. Rapid-growth pyramids have high youth dependency; urn-shaped pyramids have high elderly dependency. Both extremes strain economic and environmental resources.
These equations connect the visual information in an age structure diagram to testable, quantitative predictions. When the AP exam provides a pyramid alongside demographic data, you can expect to calculate the rate of natural increase, estimate doubling time, or compute a dependency ratio. Mastering these formulas ensures you can move fluently between the graphical representation and its numerical implications.
SECTION 5
Detailed Breakdown — The Three Pyramid Shapes
| Characteristic | Rapid Growth | Slow / Zero Growth | Negative Growth |
|---|---|---|---|
| Pyramid Shape | Broad-based triangle | Column or pillar | Urn (inverted pyramid) |
| TFR | > 4.0 | ≈ 1.8–2.1 | < 1.5 |
| DTM Stage | Stage 2 | Stage 3 / early Stage 4 | Late Stage 4 / Stage 5 |
| Example Countries | Niger, Uganda, Afghanistan | United States, Brazil, India (2020s) | Japan, Germany, Italy |
| Dependency Ratio | High (youth) | Moderate (balanced) | High (elderly) |
| Environmental Pressure | Rising resource demand: food, water, deforestation | Stabilizing but per-capita consumption may be high | Reduced growth pressure, but aging infrastructure and workforce shortages |
Comparison of the three major age structure types
It is essential to recognize that these three categories are idealized endpoints on a spectrum. Many countries display transitional shapes—for instance, a pyramid with a slightly narrowing base suggests fertility is declining but the population still has substantial growth momentum from the large cohorts already born. Furthermore, anomalies such as wars, pandemics, or migration events create cohort bulges or indentations that deviate from the smooth theoretical shapes. China's age structure, for example, shows a pronounced narrowing in the 0–14 cohort due to the one-child policy implemented in 1980, while simultaneously exhibiting a bulge in the 25–59 cohort from the high-fertility decades preceding the policy.
SECTION 6
Worked Example — Interpreting Country X
Consider a hypothetical Country X with the following demographic data: total population = 50 million, CBR = 38 per 1,000, CDR = 10 per 1,000, percentage aged 0–14 = 42%, percentage aged 15–64 = 54%, percentage aged 65+ = 4%. We will determine the growth trajectory, doubling time, and dependency ratio.
Country X Demographic Analysis
- 1
Step 1 — Calculate Rate of Natural Increase
Apply the formula: r = (CBR − CDR) / 10 = (38 − 10) / 10 = 28 / 10.r = 2.8% per year - 2
Step 2 — Estimate Doubling Time
Use the Rule of 70: t₂ = 70 / r = 70 / 2.8.t₂ ≈ 25 years - 3
Step 3 — Calculate the Dependency Ratio
The dependent population includes those aged 0–14 and 65+. In absolute terms: (0.42 × 50 million) + (0.04 × 50 million) = 21 million + 2 million = 23 million. Working-age population: 0.54 × 50 million = 27 million. DR = (23 / 27) × 100.DR ≈ 85.2 dependents per 100 working-age individuals - 4
Step 4 — Identify the Pyramid Shape and DTM Stage
With 42% of the population under age 15, an extremely high CBR, and a growth rate of 2.8%, Country X displays a broad-based triangular pyramid characteristic of rapid growth. The declining CDR (10/1,000) paired with a still-high CBR (38/1,000) indicates the country is in Stage 2 of the Demographic Transition Model, where medical advances and improved sanitation have lowered mortality but fertility remains high.Classification: Rapid growth — DTM Stage 2 - 5
Step 5 — Environmental Implications
At this growth rate, Country X's population will reach 100 million in approximately 25 years. This doubling implies a proportional increase in demand for food, freshwater, arable land, and energy. The high youth dependency ratio means substantial investment in education, healthcare, and infrastructure is needed immediately. Environmental pressures such as deforestation, soil degradation, and biodiversity loss are likely to intensify if resource management policies are not implemented alongside family planning programs.
SECTION 7
Strengths, Limitations & Comparisons
| Strengths | Limitations |
|---|---|
| Provide an instant visual summary of a population's growth trajectory without requiring complex statistical analysis | Cannot capture income distribution, urbanization rates, or other socioeconomic factors that influence resource consumption |
| Allow comparison across countries using a standardized format, making global patterns immediately apparent | Static snapshots: a single diagram reflects one moment in time and cannot show the rate of change in fertility or mortality |
| Reveal population momentum—the built-in growth or decline embedded in the current age distribution regardless of future fertility changes | Do not account for migration, which can dramatically alter age structure (e.g., labor-importing Gulf states) |
| Directly inform policy decisions on education, healthcare, pension systems, and environmental resource management | Five-year cohort groupings can mask significant intra-cohort variation, such as differing mortality rates between ages 0–1 and 1–4 |
| Can be overlaid on historical data or projected forward to visualize demographic change over decades | May lead to oversimplified narratives (e.g., 'young populations are always a problem') without considering cultural and economic context |
Strengths and limitations of age structure diagrams
CONTEXT MATTERS
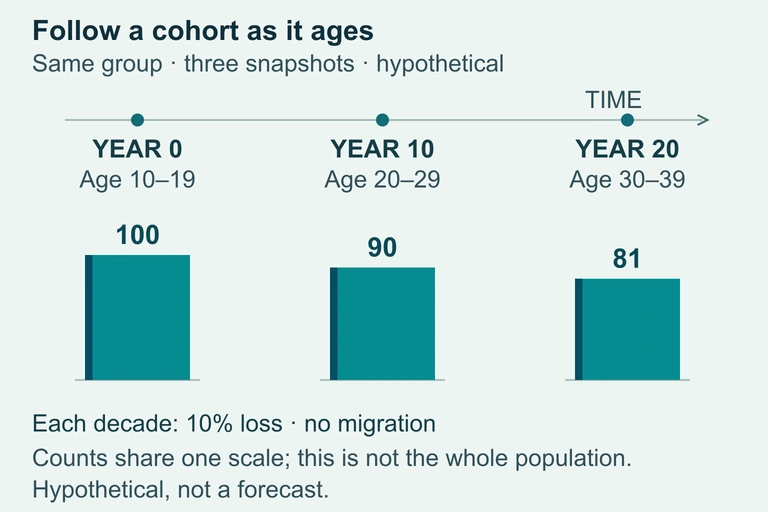 A hypothetical cohort moves into older age groups while its size declines. These examples do not predict a real population.
SECTION 8
Connections to Advanced Topics
Age structure diagrams sit at the intersection of several broader topics in AP Environmental Science. Understanding how they connect to carrying capacity, resource consumption models, and sustainability frameworks deepens your ability to synthesize across exam units.
| Age Structure Diagrams | Advanced / Related Concept |
|---|---|
| Show current proportions of pre-reproductive, reproductive, and post-reproductive cohorts | Survivorship Curves (Type I, II, III) describe age-specific mortality patterns that help explain why pyramids taper as they do |
| Predict population growth or decline based on shape | Logistic Growth Model (dN/dt = rN[(K − N)/K]) mathematically describes how populations approach carrying capacity (K), the trajectory that pyramids qualitatively forecast |
| Reveal dependency ratios and economic pressure points | Demographic Dividend: when a large working-age cohort (low dependency ratio) fuels economic growth—an opportunity visible in transitional pyramids |
| Illustrate population momentum from large young cohorts | IPAT Model (I = P × A × T) accounts for the fact that population growth's environmental impact also depends on affluence and technology |
| Classify countries into DTM stages based on shape | Epidemiologic Transition: as countries move through DTM stages, leading causes of death shift from infectious diseases to chronic/degenerative diseases, reshaping the upper tiers of the pyramid |
Age structure diagrams in the context of related AP Environmental Science topics
Looking ahead, demographers increasingly use cohort-component projection methods that apply age-specific fertility and mortality rates to each cohort in the pyramid, then project them forward year by year. These models underpin the United Nations Population Division's projections, which estimate global population will reach approximately 10.4 billion by 2100 before potentially declining. On the AP exam, you will not be asked to perform full cohort-component projections, but understanding that age structure diagrams form the input data for these sophisticated models will help you appreciate why they are so central to environmental science.
SECTION 9
Practice Problems
Question 1: CONCEPTUAL
- A. The country is in Stage 4 of the Demographic Transition Model with below-replacement fertility.
- B. The country has high birth rates and declining death rates, placing it in Stage 2 of the DTM with rapid population growth.
- C. The country has achieved zero population growth with a TFR of approximately 2.1.
- D. The country is experiencing significant population decline due to emigration of working-age adults.
Show answer (B)
Question 2: BASIC CALCULATION
- A. 14 years
- B. 23 years
- C. 30 years
- D. 44 years
Show answer (B)
Question 3: INTERMEDIATE
- A. Country A displays a triangular pyramid, while Country B displays an urn shape.
- B. Both countries display columnar shapes because TFR does not affect pyramid shape.
- C. Country A displays an urn (inverted) shape with high elderly dependency, while Country B displays a broad-based triangle with high youth dependency.
- D. Country A and Country B have identical dependency ratios because their dependent populations are proportional.
Show answer (C)
Question 4: APPLIED
4 ptsShow answer
Question 5: CRITICAL THINKING
4 ptsShow answer
SUMMARY
Lesson Summary
Summary
Age structure diagrams (population pyramids) organize a population by age cohort and sex, producing one of three characteristic shapes: a broad-based triangle for rapid growth (DTM Stage 2, TFR > 4), a column for slow or zero growth (DTM Stage 3–4, TFR ≈ 2.1), or an urn shape for negative growth (DTM Stage 4–5, TFR < 1.5). Key quantitative tools include the rate of natural increase (r = (CBR − CDR) / 10), the Rule of 70 for doubling time (t₂ = 70 / r), and the dependency ratio, which quantifies the burden on the working-age population.
While age structure diagrams are indispensable for forecasting demographic trajectories and identifying population momentum, they must be interpreted alongside consumption and technology data—as captured by the IPAT model—to accurately assess environmental impact. On the AP Environmental Science exam, expect to identify pyramid shapes, link them to Demographic Transition Model stages, perform calculations involving growth rates and doubling times, and analyze how population structure interacts with resource demand and sustainability.