Photoelectron
Spectroscopy
Understand how PES data reveals electron configurations, subshell energies, and the structure of atoms using the photoelectric effect.
What is Photoelectron Spectroscopy?
Photoelectron spectroscopy (PES) is an experimental technique that shoots high-energy photons at a sample of gaseous atoms. The photons have enough energy to eject electrons from every subshell. By measuring the kinetic energy of the ejected electrons, scientists determine the binding energy of each electron in the atom.
One photoelectron spectroscopy chamber
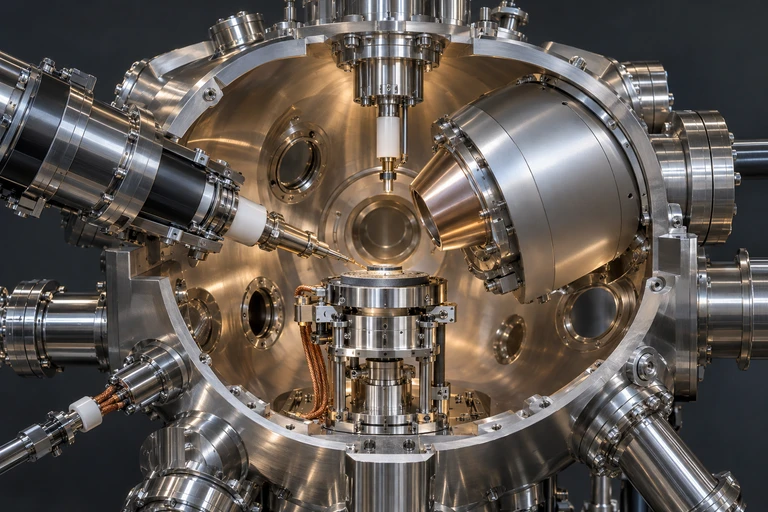 Photoelectron spectroscopy removes electrons with photons and measures the outgoing electrons’ kinetic energies.
The Photoelectric Effect Foundation
PES is based on the photoelectric effect. When a photon of known energy strikes an atom, it can eject an electron. The fundamental energy equation is:
Electrons that are closer to the nucleus (core electrons) have higher binding energies because they experience a stronger nuclear attraction. Valence electrons are held less tightly and have lower binding energies.
Anatomy of a PES Spectrum
PES Spectrum: Nitrogen \( Z = 7 \)
The Core Energy Equation
Binding Energy and \( Z_{\text{eff}} \)
The binding energy of an electron depends on the effective nuclear charge (\( Z_{\text{eff}} \)) it experiences. Within a given atom:
PES vs. Ionization Energy
| PES Binding Energy | Ionization Energy | |
|---|---|---|
| What it measures | Energy to remove an electron from a specific subshell | Energy to remove the easiest-to-remove electron |
| Electrons probed | All electrons (every subshell) | Valence electrons (outermost only) |
| Data output | Full spectrum with multiple peaks | Single value (first IE) |
| Relationship | First IE = binding energy of the rightmost PES peak (lowest BE) | |
How to Read a PES Spectrum
Example 1: Identify the Element
Example 2: Comparing Li and Be
Example 3: A Third-Period Element
Trends in Binding Energy
Subshell Energy Ordering
Within a principal energy level, the subshell with the higher angular momentum quantum number (\( l \)) has a lower binding energy because of electron shielding and penetration effects:
Common Mistakes in PES
PES Summary
| Feature | What It Tells You | How to Read It |
|---|---|---|
| Number of peaks | Number of occupied subshells | Count distinct peaks |
| Peak position (x-axis) | Binding energy of that subshell | Farther left = higher BE = closer to nucleus |
| Peak height (y-axis) | Number of electrons in subshell | Compare relative heights |
| Rightmost peak BE | First ionization energy | Lowest BE = easiest electron to remove |
| Total electrons (sum) | Atomic number \( Z \) | Add all peak electron counts |
Question 1 of 5
A PES spectrum shows four peaks with relative electron counts of 2, 2, 6, and 2. Which element is this?
Question 2 of 5
On a PES spectrum, which subshell's peak would appear farthest to the left (highest binding energy)?
Question 3 of 5
The first ionization energy of an element can be determined from its PES spectrum by looking at:
Question 4 of 5
When comparing the PES spectra of oxygen (\( Z = 8 \)) and fluorine (\( Z = 9 \)), which statement is correct?
Question 5 of 5
A PES spectrum shows three peaks. The first two have equal heights and the third peak is 1.5 times as tall as each of the first two. If the first peak has 2 electrons, what is the element?