Mass Spectra of
Elements
Learn how mass spectrometry reveals isotopic composition, calculates average atomic mass, and connects spectral data to the periodic table.
What Is Mass Spectrometry?
Mass spectrometry is an analytical technique that separates atoms or molecules based on their mass-to-charge ratio (\( m/z \)). A sample is ionized, accelerated through electric and magnetic fields, and detected to produce a mass spectrum.
Key Terms to Know
Inside the Instrument
Inside one magnetic-sector mass spectrometer
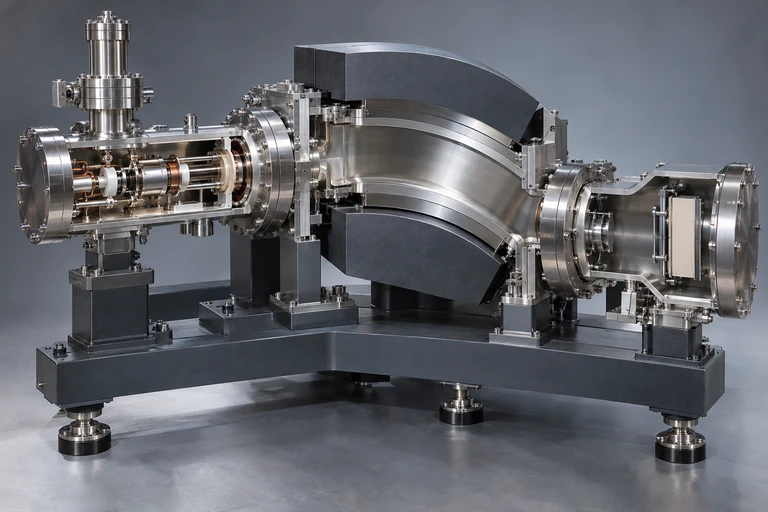 A magnetic-sector mass spectrometer separates ions according to their mass-to-charge ratios.
Reading a Mass Spectrum
The Core Formula
The average atomic mass listed on the periodic table is a weighted average of all naturally occurring isotopes:
For an element with two isotopes:
Why the Tallest Peak Matters
Atomic Mass vs. Mass Number
| Average Atomic Mass | Mass Number (\(A\)) | |
|---|---|---|
| Definition | Weighted average of all isotopic masses | Protons + neutrons in one specific isotope |
| Value type | Decimal (e.g., 35.45) | Whole number (e.g., 35 or 37) |
| Found on | Periodic table | Mass spectrum x-axis |
| Units | amu (or g/mol) | None (dimensionless count) |
How to Calculate Average Atomic Mass
Worked Example: Chlorine
From the mass spectrum: Cl-35 at 75.77% and Cl-37 at 24.23%.
Worked Example: Boron
Harder Example: Magnesium
Reverse Problem: Finding Abundance
If you know the average atomic mass and isotopic masses, you can solve for the fractional abundances.
Monoisotopic Elements
Some elements have only one naturally occurring isotope. Their mass spectrum shows a single peak at 100% abundance.
Common Mistakes to Avoid
Summary at a Glance
| Concept | Key Idea | On the Spectrum |
|---|---|---|
| Isotope | Same element, different neutron count | Each peak = one isotope |
| x-axis (\( m/z \)) | Mass-to-charge ratio | Position of each bar |
| y-axis | Relative abundance | Height of each bar |
| Tallest peak | Most abundant isotope | Average mass is nearest here |
| Average mass | \( \sum f_i \times m_i \) | Not directly shown: you calculate it |
Question 1 of 5
A mass spectrum of element X shows two peaks: \( m/z = 63 \) at 69.2% and \( m/z = 65 \) at 30.8%. What is the average atomic mass of element X?
Question 2 of 5
An element has an average atomic mass of 28.09 amu and three isotopes: Si-28, Si-29, Si-30. Which isotope has the greatest relative abundance?
Question 3 of 5
A student calculates the average atomic mass of bromine as \( (79 + 81) / 2 = 80.0 \) amu. The actual value is 79.90 amu. What error did the student make?
Question 4 of 5
A mass spectrum shows a single peak at \( m/z = 197 \). What can you conclude about this element?
Question 5 of 5
Lithium has two isotopes: Li-6 (\( f = 0.0759 \)) and Li-7 (\( f = 0.9241 \)). What is the average atomic mass?