
SECTION 1
Historical Context & Motivation
The idea that light carries information about matter is deceptively modern. For most of human history, light was understood only as a tool for vision, not as a probe of atomic and molecular structure. The breakthrough came when scientists noticed that heated elements produced characteristic colors — sodium's persistent yellow, strontium's crimson — and that these colors could be separated into discrete lines using a prism. This observation demanded explanation: why do different elements emit different wavelengths, and what does that pattern reveal about the atom? Spectroscopy, the systematic study of how electromagnetic radiation interacts with matter, arose from precisely this question.
1666 • Newton's Prism Experiment
1814 • Fraunhofer Lines
1860 • Kirchhoff & Bunsen — Elemental Fingerprints
1900 • Planck's Quantum Hypothesis
1913 • Bohr Model & Hydrogen Spectrum
The central question that spectroscopy addresses remains as relevant today as it was in the 19th century: how can we use the interaction between electromagnetic radiation and matter to determine what substances are present, and in what quantities? On the AP Chemistry exam, you need to understand how the electromagnetic spectrum is organized, why different regions of the spectrum probe different molecular properties, and how Beer–Lambert law connects absorbance to concentration.
SECTION 2
Core Principles & Definitions
Electromagnetic radiation is a transverse wave characterized by oscillating electric and magnetic fields propagating at the speed of light. All forms of EM radiation — from radio waves to gamma rays — share this wave nature but differ in wavelength (λ), frequency (ν), and therefore energy. Spectroscopy exploits the fact that atoms and molecules absorb or emit radiation only at specific energies that correspond to allowed transitions between quantized energy states.
Wave–Particle Duality
Quantized Energy Levels
Absorption vs. Emission
The Electromagnetic Spectrum
Beer–Lambert Law
SECTION 3
The Electromagnetic Spectrum — Visual Overview
The diagram above illustrates a fundamental organizing principle: as you move from radio waves to gamma rays, wavelength decreases while frequency and photon energy increase. Each region of the spectrum interacts with matter through a different mechanism. Infrared radiation excites molecular vibrations (bond stretching and bending), while UV-visible light promotes valence electrons to higher-energy orbitals. On the AP Chemistry exam, the most commonly tested regions are UV-visible (for electronic transitions and Beer–Lambert law calculations) and infrared (for identifying functional groups). Notice that the visible region is only a tiny sliver of the full spectrum, spanning roughly 380 nm (violet) to 700 nm (red). A substance's perceived color is the complement of the color it absorbs — a solution that absorbs orange light appears blue to the eye.
SECTION 4
Mathematical Framework
Three equations form the quantitative backbone of spectroscopy in AP Chemistry. Together, they connect wavelength, frequency, energy, and concentration into a coherent mathematical framework.
WAVE EQUATION
c = speed of light (3.00 × 10⁸ m s⁻¹), λ = wavelength (m), ν = frequency (Hz = s⁻¹). Because c is constant, wavelength and frequency are inversely proportional.
PLANCK–EINSTEIN RELATION
h = Planck's constant (6.626 × 10⁻³⁴ J s). This equation links a photon's energy to its frequency (or wavelength). Higher frequency means higher energy; shorter wavelength means higher energy.
BEER–LAMBERT LAW
A = absorbance (unitless), ε = molar absorptivity (L mol⁻¹ cm⁻¹), b = path length through the sample (cm), c = molar concentration (mol L⁻¹). Absorbance is logarithmic: A = −log₁₀(I/I₀), where I₀ is incident intensity and I is transmitted intensity.
TRANSMITTANCE–ABSORBANCE RELATIONSHIP
T = transmittance (fraction of light passing through). When A = 1, only 10% of light is transmitted (T = 0.10). When A = 2, only 1% passes through (T = 0.01).
SECTION 5
Types of Spectroscopy & Their Applications
Different spectroscopic techniques exploit different regions of the electromagnetic spectrum and probe different aspects of molecular structure. For AP Chemistry, UV-Vis spectroscopy and IR spectroscopy are the most relevant, but understanding the broader landscape helps you appreciate why chemists choose a particular technique for a given analytical problem.
| Technique | EM Region | What It Probes | AP Chemistry Relevance |
|---|---|---|---|
| UV-Vis | 190–800 nm | Valence electron transitions | Beer–Lambert law, solution color, concentration analysis |
| IR | 2.5–25 μm | Molecular vibrations (bond stretching/bending) | Functional group identification, bond strength |
| Mass Spec | N/A (not EM) | Mass-to-charge ratio of ions | Molar mass, isotope patterns |
| PES (Photoelectron) | UV / X-ray | Binding energies of all electrons | Electron configuration, subshell energies |
Spectroscopic techniques relevant to AP Chemistry
Notice that mass spectrometry is not truly a form of spectroscopy (it does not involve electromagnetic radiation), but it is grouped with spectroscopic methods in analytical chemistry because it provides complementary structural information. Photoelectron spectroscopy (PES) is particularly important for AP Chemistry because it provides direct experimental evidence for the shell and subshell model of electron configuration. Each peak in a PES spectrum corresponds to electrons in a specific subshell, with peak height proportional to the number of electrons and peak position indicating binding energy.
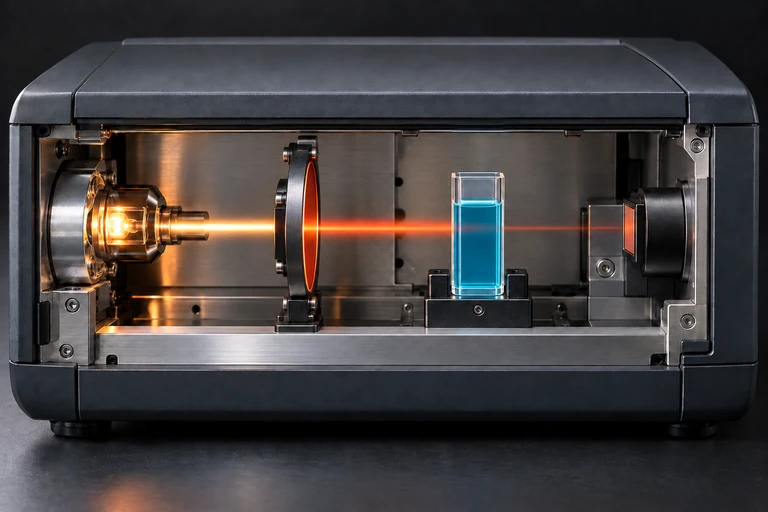 A photometer directs selected light through a cuvette and measures the transmitted light at a detector.
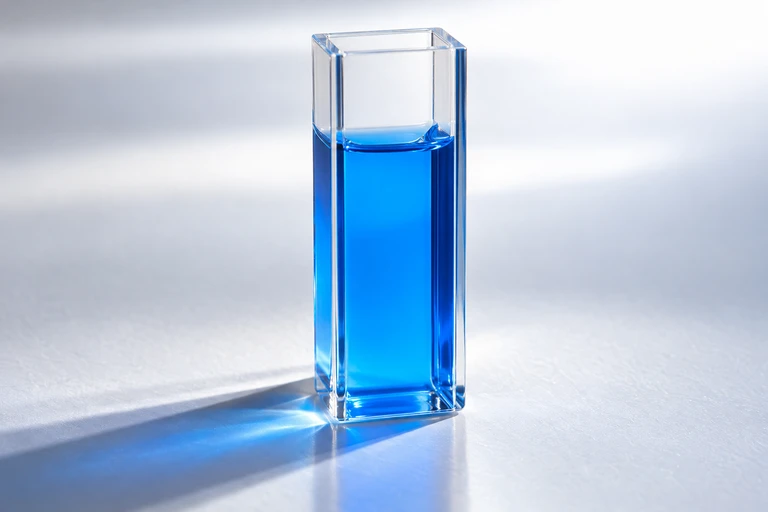 A blue solution transmits some visible wavelengths more strongly than others; its absorption depends on wavelength.
SECTION 6
Worked Example — Beer–Lambert Calculation
A common AP Chemistry problem requires you to determine the concentration of an analyte in solution using Beer–Lambert law. Let's walk through a representative example.
Worked example
- 1
Step 1 — Identify Given Values
A solution of KMnO₄ has an absorbance of A = 0.750 at 525 nm. The molar absorptivity at this wavelength is ε = 2455 L mol⁻¹ cm⁻¹. The cuvette path length is b = 1.00 cm. We need to find the molar concentration c. - 2
Step 2 — Write Beer–Lambert Law
A = εbc. Rearranging for concentration: c = A / (εb). - 3
Step 3 — Substitute and Solve
c = 0.750 / (2455 L mol⁻¹ cm⁻¹ × 1.00 cm) = 0.750 / 2455 mol L⁻¹c = 3.06 × 10⁻⁴ mol L⁻¹ (or 0.306 mM) - 4
Step 4 — Verify Reasonableness
The absorbance of 0.750 is below 1.0, confirming we are within the linear range of Beer–Lambert law. The concentration is on the order of 10⁻⁴ M, which is typical for a strongly absorbing species like permanganate measured in a standard 1.00-cm cuvette. The result is reasonable.
SECTION 7
Strengths, Limitations & Complementary Techniques
| Aspect | Strengths | Limitations |
|---|---|---|
| UV-Vis Spectroscopy | Fast, non-destructive, quantitative (Beer–Lambert), inexpensive | Limited structural detail; requires chromophore; non-linear at high concentrations |
| IR Spectroscopy | Identifies functional groups; works on solids, liquids, gases | Water absorbs broadly in IR; complex spectra hard to interpret fully |
| PES | Directly reveals electron configuration and subshell energies | Requires vacuum; does not give molecular structure |
| Beer–Lambert Law | Simple, linear, easily calibrated | Breaks down at A > 1 (high concentration), with scattering samples, or with fluorescent analytes |
SECTION 8
Connections to Quantum Theory & Advanced Topics
The spectroscopic phenomena you encounter in AP Chemistry are grounded in quantum mechanics. Every absorption or emission line corresponds to a transition between quantized states described by the Schrödinger equation. At the AP level, you treat these transitions semi-quantitatively — using E = hν to calculate photon energies and Beer–Lambert law to relate absorbance to concentration. At the college and graduate level, the theory deepens considerably.
| Concept | AP Chemistry Level | Advanced / University Level |
|---|---|---|
| Electronic transitions | ΔE = hν; electrons jump between shells/subshells | Selection rules (Δl = ±1); term symbols; spin-orbit coupling |
| Molecular vibrations | IR absorption requires change in dipole moment; identifies functional groups | Harmonic/anharmonic oscillator models; normal mode analysis; group theory |
| Beer–Lambert | A = εbc with linear calibration curves | Deviations: chemical, instrumental, stray light; multiwavelength matrix methods |
| PES | Peak positions reflect binding energy; peak heights reflect electron count | Koopmans' theorem; relaxation effects; chemical shifts in XPS |
If you continue to general chemistry II, organic chemistry, or physical chemistry, you will use IR and NMR spectroscopy extensively for structure determination. Quantum mechanical selection rules dictate which transitions are allowed (and thus which spectral lines appear), while group theory predicts how many IR-active modes a molecule possesses. For now, the essential takeaway is that spectroscopy is the experimental bridge between quantum theory and observable chemical behavior.
SECTION 9
Practice Problems
Question 1: CONCEPTUAL
- A. 450–490 nm (blue light)
- B. 580–620 nm (orange light)
- C. 380–420 nm (violet light)
- D. 620–700 nm (red light)
Show answer (B)
Question 2: BASIC CALCULATION
- A. 4.09 × 10⁻¹⁹ J
- B. 4.09 × 10⁻²² J
- C. 1.36 × 10⁻²⁷ J
- D. 3.22 × 10⁻¹⁹ J
Show answer (A)
Question 3: INTERMEDIATE
- A. 0.270
- B. 0.540
- C. 1.080
- D. 0.135
Show answer (A)
Question 4: APPLIED
Show answer
Question 5: CRITICAL THINKING