

SECTION 1
Historical Context & Motivation
For most of human history, solutions were understood only through their observable properties—taste, color, and conductivity—without any framework for what was happening at the molecular level. The quest to represent what solutions actually look like at the particulate scale drove some of the most consequential advances in chemistry. Understanding the history of how scientists developed representations of solutions reveals the progressive refinement from macroscopic observation to the particulate-level models that anchor modern AP Chemistry.
1803 • Dalton's Atomic Theory
1884 • Arrhenius Electrolyte Theory
1923 • Debye–Hückel Theory
1960s • Molecular Modeling & Computation
2010s • AP Chemistry Curriculum Redesign
The central question that emerged from this historical arc remains the one you will master in this lesson: How do we accurately represent the composition, structure, and interactions within a solution at both the macroscopic and particulate levels? Answering this question requires fluency in translating between chemical formulas, concentration expressions, and particulate diagrams—skills that are tested repeatedly on the AP Chemistry exam.
SECTION 2
Core Principles & Definitions
A solution is a homogeneous mixture in which one or more solutes are uniformly dispersed within a solvent at the molecular or ionic level. Unlike heterogeneous mixtures—where distinct phases can be identified—solutions exhibit uniform composition throughout, meaning any representative sample drawn from the mixture has the same ratio of solute to solvent particles. The ability to represent this uniformity using particulate diagrams, chemical equations, and concentration expressions forms the foundation of this topic.
Particulate Representations
Electrolyte vs. Nonelectrolyte
Concentration Expressions
Solute–Solvent Interactions
Chemical Equations for Dissolution
KEY TAKEAWAY
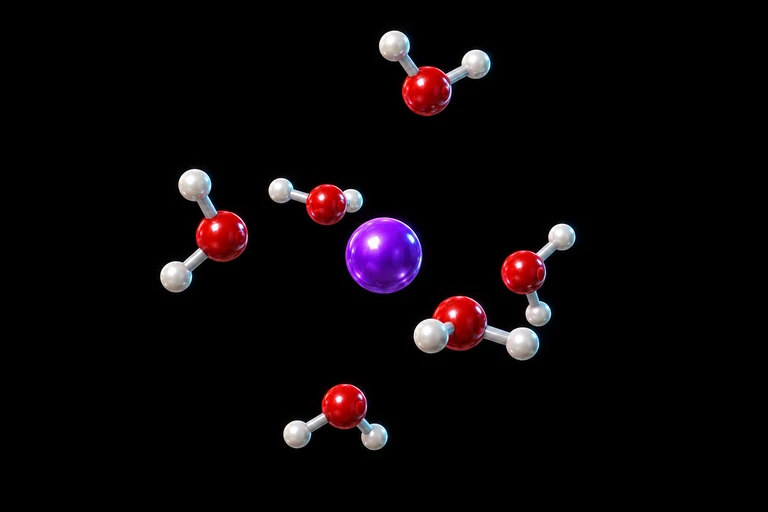 Water molecules orient their partially negative oxygen atoms toward a sodium ion.
SECTION 3
Visual Explanation — Particulate Diagrams
The particulate diagram is arguably the most important representational tool tested on the AP Chemistry exam. These diagrams depict a magnified view of a small volume of solution, showing individual particles as circles or clusters of circles. The diagram below contrasts three types of aqueous solutions: a strong electrolyte, a weak electrolyte, and a nonelectrolyte—all at the same overall molar concentration.
Notice several critical features in the diagram above. First, solute particles are uniformly distributed throughout the solvent in all three panels—this is what distinguishes a solution from a suspension or colloid. Second, the strong electrolyte panel contains no intact NaCl formula units; a common AP exam error is drawing paired Na⁺ and Cl⁻ touching each other. Third, the weak electrolyte panel shows an equilibrium mixture: the dominant species is the intact molecular form, with only a small percentage present as ions. This distinction between strong and weak electrolytes is one of the most frequently tested concepts in the representation of solutions.
SECTION 4
Mathematical Framework — Concentration Expressions
Quantifying the composition of a solution requires expressing the ratio of solute to solvent (or to total solution) using one of several concentration expressions. Each expression has particular utility depending on the context—colligative properties, dilution calculations, or stoichiometric analysis. Particulate diagrams can be connected directly to these expressions by counting the relative number of solute and solvent particles depicted.
MOLARITY
M = molarity (mol·L⁻¹), nsolute = moles of solute, Vsolution = volume of solution in liters. Molarity is the most commonly used concentration unit in AP Chemistry and is essential for stoichiometric calculations involving solutions.
DILUTION EQUATION
M₁ and V₁ are the initial molarity and volume; M₂ and V₂ are the final molarity and volume. This equation derives from conservation of moles: the total moles of solute remain constant when solvent is added.
MOLE FRACTION
χA = mole fraction of component A. All mole fractions in a solution sum to 1. This is dimensionless and is used in Raoult's law and colligative property calculations.
MOLALITY
m = molality (mol·kg⁻¹). Unlike molarity, molality is independent of temperature because it is defined relative to mass rather than volume. This makes it the preferred unit for colligative property expressions such as boiling-point elevation and freezing-point depression.
AP Exam Tip
SECTION 5
Classifying Solutions by Electrolyte Behavior
A major component of representing solutions accurately is classifying the solute by its electrolyte behavior—that is, its degree of dissociation or ionization in aqueous solution. This classification directly determines what species appear in a particulate diagram and what net ionic equations look like. The table below summarizes the three categories with examples, dissolution equations, and the corresponding particulate features.
| Category | Examples | Dissolution Equation | Particulate Diagram Feature |
|---|---|---|---|
| Strong electrolyte | NaCl, KNO₃, HCl, NaOH, CaCl₂ | NaCl(s) → Na⁺(aq) + Cl⁻(aq) | Only separated ions; no intact formula units; use → (not ⇌) |
| Weak electrolyte | CH₃COOH, HF, NH₃, H₂CO₃ | CH₃COOH(aq) ⇌ CH₃COO⁻(aq) + H⁺(aq) | Mostly intact molecules with a few ions; use ⇌ to indicate equilibrium |
| Nonelectrolyte | C₆H₁₂O₆, C₂H₅OH, CO(NH₂)₂ | C₆H₁₂O₆(s) → C₆H₁₂O₆(aq) | Only intact molecules; no ions present; does not conduct electricity |
Classification of solutes by electrolyte behavior in aqueous solution
When drawing particulate diagrams on the AP exam, a critical rule to internalize is the one-to-many principle for strong electrolytes: one formula unit of CaCl₂ produces one Ca²⁺ ion and two Cl⁻ ions, so if you dissolve four formula units, your diagram must show four Ca²⁺ and eight Cl⁻ ions uniformly dispersed. Similarly, one formula unit of Al₂(SO₄)₃ dissociates into two Al³⁺ and three SO₄²⁻ ions. Maintaining the correct stoichiometric ratio of ions is essential for receiving full credit on free-response questions.
SECTION 6
Worked Example — Interpreting a Particulate Diagram
Consider the following scenario: A particulate diagram of a 1.00 L aqueous solution shows 6 Na⁺ ions, 6 Cl⁻ ions, 2 Ca²⁺ ions, and 4 Cl⁻ ions (for a total of 10 Cl⁻ ions), uniformly distributed among water molecules. Each particle in the diagram represents 0.10 mol. Determine the molarity of each dissolved salt and the total Cl⁻ concentration.
Finding Molarities from a Particulate Diagram
- 1
Step 1 — Identify the Ions and Their Sources
The diagram contains Na⁺, Ca²⁺, and Cl⁻ ions. NaCl dissociates as NaCl → Na⁺ + Cl⁻, so 6 Na⁺ ions correspond to 6 original NaCl formula units. CaCl₂ dissociates as CaCl₂ → Ca²⁺ + 2 Cl⁻, so 2 Ca²⁺ ions correspond to 2 original CaCl₂ formula units, producing 4 Cl⁻ ions. Total Cl⁻ = 6 (from NaCl) + 4 (from CaCl₂) = 10, which matches the diagram.NaCl: 6 formula units; CaCl₂: 2 formula units - 2
Step 2 — Convert Particle Counts to Moles
Each particle represents 0.10 mol, so: moles of NaCl = 6 × 0.10 mol = 0.60 mol and moles of CaCl₂ = 2 × 0.10 mol = 0.20 mol.n(NaCl) = 0.60 mol; n(CaCl₂) = 0.20 mol - 3
Step 3 — Calculate Molarities
M = n / V. For NaCl: M = 0.60 mol / 1.00 L = 0.60 M. For CaCl₂: M = 0.20 mol / 1.00 L = 0.20 M.M(NaCl) = 0.60 M; M(CaCl₂) = 0.20 M - 4
Step 4 — Calculate Total Cl⁻ Concentration
Total Cl⁻ moles = (6 + 4) × 0.10 mol = 1.00 mol. Therefore, [Cl⁻] = 1.00 mol / 1.00 L = 1.00 M. Equivalently, [Cl⁻] = (1)(0.60) + (2)(0.20) = 0.60 + 0.40 = 1.00 M, using the stoichiometric coefficients from each dissociation equation.[Cl⁻] = 1.00 M
Common Mistake
SECTION 7
Comparing Representation Types
AP Chemistry expects you to move fluidly between three levels of representation: the macroscopic (what you observe), the particulate (molecular-level diagrams), and the symbolic (chemical equations, formulas, and concentration expressions). Each representation has distinct strengths and limitations for communicating solution properties. The table below compares these three levels.
| Feature | Macroscopic | Particulate | Symbolic |
|---|---|---|---|
| What it shows | Observable properties: color, phase, conductivity | Individual atoms, molecules, and ions in relative positions | Chemical formulas, equations, concentration values |
| Strengths | Directly observable; intuitive; connects to lab experience | Shows degree of dissociation; reveals molecular interactions; distinguishes strong from weak electrolytes | Compact; allows quantitative calculations; universally standardized |
| Limitations | Cannot distinguish between electrolyte types; no molecular detail | Not to scale; limited particle count represents a vast number of actual molecules | Abstract; does not convey spatial arrangement or relative proportions visually |
| AP exam usage | Lab-based questions; identifying solution properties | Drawing or interpreting diagrams (very common on FRQs) | Balancing equations; stoichiometry; concentration calculations |
Comparison of macroscopic, particulate, and symbolic representations of solutions
KEY TAKEAWAY
SECTION 8
Connections to Advanced Topics
The representations of solutions you have studied here form the conceptual scaffolding for several more advanced AP Chemistry topics. Understanding how to depict dissolved species accurately is not an isolated skill—it connects directly to equilibrium expressions, acid-base theory, electrochemistry, and colligative properties. Recognizing these connections now will help you see the bigger picture of the AP Chemistry curriculum.
| This Lesson's Concept | Advanced Extension | How They Connect |
|---|---|---|
| Strong vs. weak electrolyte diagrams | Equilibrium & acid-base chemistry | Weak electrolyte diagrams show equilibrium mixtures; the ratio of ions to molecules relates to Ka or Kb values |
| Ion concentration calculations | Solubility equilibria (Ksp) | Ksp expressions require knowing the concentrations of individual dissociated ions—directly from particulate-level thinking |
| Molarity and dilution | Solution stoichiometry & titrations | Titration calculations rely on M₁V₁ = M₂V₂ and on correctly identifying species in solution |
| Number of dissolved particles | Colligative properties | Boiling-point elevation and freezing-point depression depend on the total number of dissolved particles (van 't Hoff factor i), not just moles of solute |
| Ion identification in solution | Electrochemistry & galvanic cells | Half-cell reactions require knowing which ions are present in the electrolyte solution, informed by dissociation representations |
How representations of solutions connect to later AP Chemistry topics
One particularly important forward connection is the van 't Hoff factor (i), which quantifies how many particles a single formula unit produces upon dissolution. For NaCl, i = 2; for CaCl₂, i = 3; for glucose, i = 1. This factor appears directly in colligative property equations like ΔTb = i × Kb × m. The ability to determine i comes directly from the particulate representations studied in this lesson—if you can draw the correct diagram, you can count the particles and determine i.
SECTION 9
Practice Problems
Question 1: CONCEPTUAL
- A. NaCl
- B. HCl
- C. C₆H₁₂O₆ (glucose)
- D. KOH
Show answer (C)
Question 2: BASIC CALCULATION
- A. 0.30 M
- B. 0.60 M
- C. 1.20 M
- D. 1.80 M
Show answer (C)
Question 3: INTERMEDIATE
- A. Percent ionization = 20%; [HA] = 0.48 M
- B. Percent ionization = 25%; [HA] = 0.48 M
- C. Percent ionization = 20%; [HA] = 0.60 M
- D. Percent ionization = 25%; [HA] = 0.36 M
Show answer (A)
Question 4: APPLIED
10 ptsShow answer
Question 5: CRITICAL THINKING
10 ptsShow answer
SUMMARY
Lesson Summary
Summary
Representing solutions in AP Chemistry requires fluency in three interconnected levels: macroscopic observations (color, conductivity, phase), particulate diagrams (showing individual atoms, molecules, and ions uniformly distributed in solvent), and symbolic representations (chemical equations, formulas, and concentration expressions like molarity, molality, and mole fraction). The defining feature of any solution is its homogeneity—solute particles must be uniformly dispersed in every diagram you draw.
The electrolyte classification of the solute determines the correct particulate representation: strong electrolytes appear as fully dissociated ions with no intact formula units; weak electrolytes show an equilibrium mixture of mostly intact molecules with a small fraction of ions; and nonelectrolytes appear only as intact molecules. When calculating ion concentrations from these diagrams, always apply the stoichiometric coefficients from the dissolution equation—a skill that connects directly to the van 't Hoff factor, colligative properties, equilibrium, and electrochemistry in later units.