
SECTION 1
Historical Context & Motivation
Long before chemists could write balanced equations or identify molecular structures, practitioners of alchemy and early chemistry recognized that some transformations occur almost instantaneously—explosions, precipitations—while others, like the rusting of iron or the fermentation of wine, unfold over hours, days, or even years. The systematic study of reaction rates, known as chemical kinetics, began in earnest during the nineteenth century when chemists sought not merely to catalogue what reactions produce, but to understand how quickly they do so and why. This question has enormous practical significance: controlling reaction speed determines the yield of an industrial process, the shelf life of a pharmaceutical, and the efficiency of a catalytic converter.
1850 • Wilhelmy's Sucrose Hydrolysis
1864 • Guldberg & Waage — Law of Mass Action
1889 • Arrhenius Equation
1913 • Bodenstein's Steady-State Approximation
1935 • Eyring's Transition State Theory
The central question of kinetics remains deceptively simple: How fast does a given reaction proceed under specified conditions, and what molecular-level events dictate that speed? Answering it requires measuring changes in concentration over time, formulating mathematical rate laws, and connecting those macroscopic observations to the microscopic collisions and rearrangements of atoms. This lesson develops the tools you need to do exactly that.
SECTION 2
Core Principles & Definitions
Before diving into equations and mechanisms, it is essential to establish a precise vocabulary. The rate of a reaction is defined as the change in concentration of a reactant or product per unit time, expressed in units of mol·L⁻¹·s⁻¹ (or M/s). Because reactant concentrations decrease while product concentrations increase, convention dictates that rates are always reported as positive values. For a generic reaction aA + bB → cC + dD, the rate is related to the disappearance of reactants and the appearance of products through stoichiometric coefficients, ensuring a single, unambiguous rate regardless of which species is monitored.
Average vs. Instantaneous Rate
Rate Law & Rate Constant
Reaction Order
Factors Affecting Rate
KEY TAKEAWAY
SECTION 3
Concentration vs. Time — A Visual Tour
The most fundamental kinetics experiment involves measuring the concentration of a reactant or product at successive time intervals and plotting the data. The shape of the resulting curve reveals the reaction order. The diagram below illustrates concentration-versus-time profiles for zero-, first-, and second-order reactions, each starting at the same initial concentration. Notice how the curvature becomes more pronounced as the order increases: a zero-order reaction depletes linearly, a first-order reaction follows an exponential decay, and a second-order reaction curves even more steeply at early times yet lingers at low concentrations longer.
The shape of the raw [A]-vs-time curve already suggests the order, but a more rigorous diagnostic is to plot linearized forms. For a zero-order reaction, [A] versus t is linear. For first order, ln[A] versus t is linear. For second order, 1/[A] versus t is linear. The slope of the appropriate linear plot yields the rate constant k (with the correct sign convention), and the y-intercept gives the initial concentration in the corresponding transformed variable.
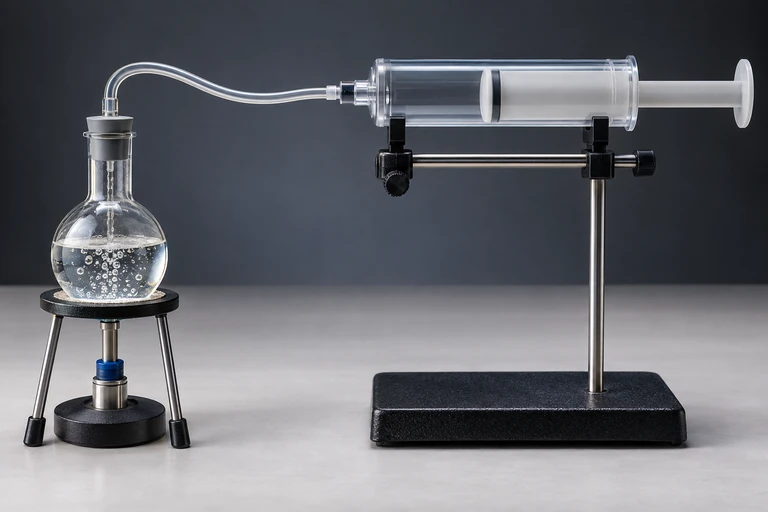 A gas syringe collects gas from a reaction, allowing its volume to be followed over time.
SECTION 4
Mathematical Framework
The mathematical heart of kinetics is the differential rate law, which expresses the instantaneous rate in terms of concentrations. By integrating this expression, we obtain the integrated rate law, which directly relates concentration to elapsed time. Both forms appear on the AP Chemistry exam and serve complementary purposes: the differential form is best for initial-rate data, while the integrated form is best for concentration-time data.
General Differential Rate Law
DIFFERENTIAL RATE LAW
k = rate constant; [A], [B] = molar concentrations of reactants; m, n = reaction orders with respect to A and B (determined experimentally). Overall order = m + n.
Integrated Rate Laws
ZERO ORDER (n = 0)
Plot [A] vs. t → straight line with slope = −k and y-intercept = [A]₀. Half-life: t₁/₂ = [A]₀ / (2k).
FIRST ORDER (n = 1)
Plot ln[A] vs. t → straight line with slope = −k. Half-life: t₁/₂ = 0.693 / k (constant, independent of [A]₀).
SECOND ORDER (n = 2)
Plot 1/[A] vs. t → straight line with slope = +k. Half-life: t₁/₂ = 1 / (k[A]₀), which increases as [A] decreases.
Arrhenius Equation
ARRHENIUS EQUATION
A = pre-exponential (frequency) factor; Eₐ = activation energy (J·mol⁻¹); R = 8.314 J·mol⁻¹·K⁻¹; T = absolute temperature (K). The linearized form is ln k = −Eₐ/R × (1/T) + ln A.
AP Exam Tip
SECTION 5
Determining Reaction Order — Linearized Plots
One of the most important skills on the AP Chemistry exam is identifying the order of a reaction from experimental data. Two complementary strategies exist: the method of initial rates and the graphical (integrated rate law) method. The method of initial rates involves performing multiple trials in which the initial concentration of only one reactant is varied while others are held constant; comparing the resulting initial rates reveals the order with respect to each reactant. The graphical method involves collecting concentration-time data from a single trial and testing which linearized plot—[A] vs. t, ln[A] vs. t, or 1/[A] vs. t—yields a straight line.
On the AP exam, you may be presented with concentration-time data and asked to determine the order graphically. The diagnostic strategy is straightforward: compute [A], ln[A], and 1/[A] at each time point, plot each against t, and identify which yields the best straight line. Alternatively, you might be given a graph and asked to read k directly from its slope. Remember that for zero- and first-order plots the slope is −k, whereas for the second-order plot the slope is +k.
SECTION 6
Worked Example — Method of Initial Rates
Consider the reaction: 2 NO(g) + O₂(g) → 2 NO₂(g). Three experiments yield the following initial-rate data:
| Trial | [NO]₀ (M) | [O₂]₀ (M) | Initial Rate (M/s) |
|---|---|---|---|
| 1 | 0.010 | 0.010 | 2.5 × 10⁻⁵ |
| 2 | 0.020 | 0.010 | 1.0 × 10⁻⁴ |
| 3 | 0.010 | 0.020 | 5.0 × 10⁻⁵ |
Initial rate data for 2 NO + O₂ → 2 NO₂
Determine the Rate Law and Rate Constant
- 1
Step 1 — Find the order with respect to NO
Compare Trials 1 and 2, where [O₂] is held constant at 0.010 M. [NO] doubles from 0.010 M to 0.020 M (factor of 2). The rate increases from 2.5 × 10⁻⁵ to 1.0 × 10⁻⁴ (factor of 4). Since 2ᵐ = 4, the order m = 2. The reaction is second order in NO.m = 2 - 2
Step 2 — Find the order with respect to O₂
Compare Trials 1 and 3, where [NO] is held constant at 0.010 M. [O₂] doubles from 0.010 M to 0.020 M (factor of 2). The rate doubles from 2.5 × 10⁻⁵ to 5.0 × 10⁻⁵ (factor of 2). Since 2ⁿ = 2, the order n = 1. The reaction is first order in O₂.n = 1 - 3
Step 3 — Write the rate law
Combining the results: Rate = k[NO]²[O₂]¹. The overall reaction order is 2 + 1 = 3 (third order overall).Rate = k[NO]²[O₂] - 4
Step 4 — Calculate k
Substitute data from any trial (using Trial 1): 2.5 × 10⁻⁵ = k (0.010)²(0.010) = k (1.0 × 10⁻⁶). Therefore k = 2.5 × 10⁻⁵ / 1.0 × 10⁻⁶ = 25. The units for a third-order rate constant are M⁻²·s⁻¹.k = 25 M⁻²·s⁻¹
Verification
SECTION 7
Factors Affecting Rates — Strengths & Limitations of Models
Two theoretical models underpin our understanding of why reaction rates depend on temperature and molecular identity: collision theory and transition state theory. Collision theory posits that reactant molecules must collide with sufficient kinetic energy (≥ Eₐ) and proper spatial orientation to react. Transition state theory refines this picture by introducing the concept of an activated complex—a transient, high-energy arrangement of atoms at the top of the energy barrier. Both models predict the Arrhenius relationship between k and temperature, but transition state theory provides deeper insight into the role of molecular geometry and entropy.
| Factor | Effect on Rate | Molecular Explanation |
|---|---|---|
| ↑ Concentration | Rate generally increases | More molecules per unit volume → higher collision frequency |
| ↑ Temperature | Rate increases (often ~doubles per 10 K) | Greater average kinetic energy → larger fraction of molecules exceed Eₐ; slightly higher collision frequency |
| Catalyst present | Rate increases (sometimes by orders of magnitude) | Provides an alternative pathway with lower Eₐ; does not change ΔG or ΔH of the overall reaction |
| ↑ Surface area | Rate increases (heterogeneous reactions) | More exposed reactant sites available for contact; applies to solids reacting with liquids or gases |
| Nature of reactants | Varies | Ionic reactions in solution are often fast (no bonds broken); reactions requiring multiple bond rearrangements are slower |
Summary of factors affecting reaction rate
KEY TAKEAWAY
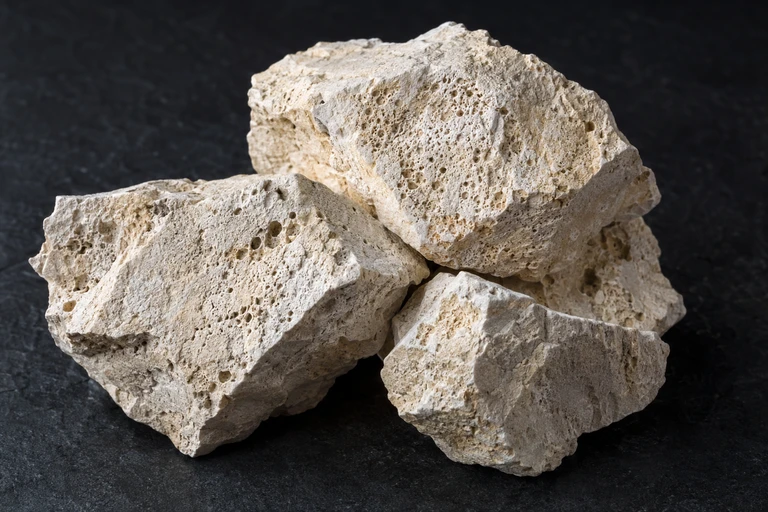 Breaking a solid into fragments exposes more surface to surrounding reactants.
SECTION 8
Connection to Reaction Mechanisms
Reaction rates provide the experimental bridge to understanding reaction mechanisms—the step-by-step molecular-level sequences through which reactants transform into products. A proposed mechanism must satisfy two criteria: the elementary steps must sum to give the overall balanced equation, and the rate law derived from the mechanism must match the experimentally determined rate law. The rate-determining step (RDS) is typically the slowest elementary step, and its molecularity dictates the form of the predicted rate law. Understanding mechanisms is the natural extension of kinetics and forms a core topic in AP Chemistry Unit 5.
| Concept | Reaction Rates (This Lesson) | Reaction Mechanisms (Advanced) |
|---|---|---|
| Focus | How fast the overall reaction proceeds | The sequence of elementary steps that constitute the pathway |
| Rate law | Determined experimentally from data | Derived theoretically from proposed elementary steps |
| Order | Measured from initial rates or integrated plots | Equals molecularity of the rate-determining step (for elementary steps) |
| Intermediates | Not explicitly considered | Species produced in one step and consumed in a subsequent step; may appear in derived rate law |
| Energy profile | Single activation energy Eₐ from Arrhenius | Multi-step energy diagram with intermediates in energy wells between transition states |
Reaction rates vs. reaction mechanisms
As you advance to the mechanism-focused portions of AP Chemistry, keep in mind that the experimental rate law is the ultimate arbiter of any proposed mechanism. A mechanism is only as credible as its agreement with measured kinetics data. The tools you have learned here—initial rate comparisons, integrated rate law plots, and Arrhenius analysis—provide the empirical foundation on which mechanistic hypotheses are tested.
SECTION 9
Practice Problems
Question 1: CONCEPTUAL
- A. The reaction is zero order, and the half-life is always independent of initial concentration.
- B. The reaction is first order, and its half-life equals 0.693/k, which does not depend on [A]₀.
- C. The reaction is second order, and doubling [A]₀ halves the half-life, keeping the measured value constant.
- D. The reaction order cannot be determined from half-life data alone.
Show answer (B)
Question 2: BASIC CALCULATION
- A. 0.0560 M
- B. 0.0975 M
- C. 0.144 M
- D. 0.200 M
Show answer (B)
Question 3: INTERMEDIATE
- A. 6.17 × 10⁴ J/mol
- B. 3.09 × 10⁴ J/mol
- C. 1.23 × 10⁵ J/mol
- D. 7.86 × 10³ J/mol
Show answer (A)
Question 4: APPLIED
5 ptsShow answer
Question 5: CRITICAL THINKING
5 ptsShow answer
SUMMARY
Reaction Rates — Key Concepts at a Glance
Summary
The rate of a reaction is the change in concentration per unit time and is expressed in M/s. The rate law (Rate = k[A]ᵐ[B]ⁿ) is determined experimentally—never from stoichiometric coefficients. The method of initial rates reveals the order with respect to each reactant by comparing trials where only one concentration changes. Integrated rate laws relate concentration to time and are used to construct linearized diagnostic plots: [A] vs. t for zero order, ln[A] vs. t for first order, and 1/[A] vs. t for second order.
The four major factors that influence rate are concentration, temperature, catalysts, and surface area. The Arrhenius equation (k = Ae⁻ᴱᵃ/ᴿᵀ) quantifies the temperature dependence of the rate constant and provides a pathway to determining the activation energy. A unique diagnostic of first-order kinetics is a constant half-life (t₁/₂ = 0.693/k), independent of initial concentration. These tools form the empirical foundation for proposing and testing reaction mechanisms.