

SECTION 1
Historical Context & Motivation
For most of the nineteenth century, chemists treated atomic mass as a single, fixed number on the periodic table—a convenient fiction that served remarkably well for stoichiometric calculations but concealed a deeper reality. The discovery that a single element could possess atoms of different masses upended classical atomic theory and demanded an entirely new analytical tool. Mass spectrometry arose from this need: a technique capable of separating atoms (or molecules) by mass-to-charge ratio and revealing the isotopic fingerprint hidden inside every sample of an element.
1886 • Canal Rays Discovered
1913 • Thomson's Parabola Method
1919 • Aston's Mass Spectrograph
1940s • Manhattan Project & Isotope Separation
Modern • High-Resolution Instruments
The central question this lesson addresses is deceptively simple: if the periodic table reports a single atomic mass for each element—35.45 u for chlorine, 63.55 u for copper—where does that number come from, and what physical measurement underlies it? The answer lies in the mass spectrum, a graphical representation that reveals every isotope present in a sample and its relative abundance. Understanding how to read and interpret mass spectra is one of the first quantitative skills you will apply in AP Chemistry.
SECTION 2
Core Principles & Definitions
Before interpreting a mass spectrum, you need a firm grasp of the foundational ideas that make the technique meaningful. An isotope is an atom of a given element that differs from other atoms of that same element only in its number of neutrons—and therefore in its mass number. Because protons define the element's identity, isotopes share chemical behavior but diverge in nuclear stability and mass. A mass spectrometer exploits this mass difference by ionizing atoms, accelerating them through electric or magnetic fields, and recording where each ion arrives on a detector; heavier ions deflect less (or arrive later in a time-of-flight instrument). The result is a plot—the mass spectrum—in which the x-axis represents mass-to-charge ratio (m/z) and the y-axis represents relative abundance.
Isotopes
Mass-to-Charge Ratio (m/z)
Relative Abundance
Weighted Average Atomic Mass
KEY TAKEAWAY
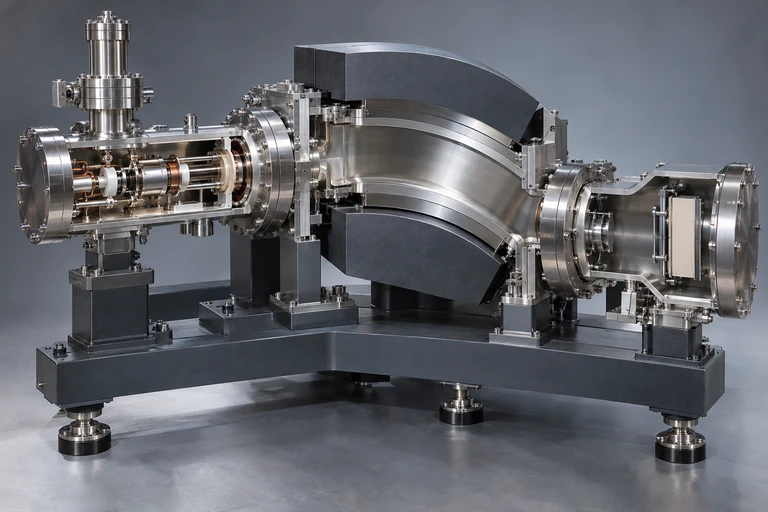 A magnetic-sector mass spectrometer separates ions according to their mass-to-charge ratios.
SECTION 3
Anatomy of a Mass Spectrum
The diagram below shows a simplified mass spectrum for chlorine (Cl). Two peaks appear at m/z = 35 and m/z = 37, corresponding to the two naturally occurring isotopes. The height of each peak encodes the relative abundance of that isotope in the sample.
Several features of this spectrum deserve attention. First, notice that only integer m/z values produce peaks because mass numbers are whole numbers (the sum of protons and neutrons). Second, the relative heights of the peaks directly encode the natural abundances of the isotopes. Third, the weighted average of 35 × 0.7577 + 37 × 0.2423 ≈ 35.45 u matches the atomic mass listed on the periodic table. This graphical connection between experimental data and the periodic table is precisely what the AP exam tests.
SECTION 4
Mathematical Framework
The quantitative backbone of mass spectrometry interpretation is the weighted average formula. For an element with n naturally occurring isotopes, the average atomic mass is the sum of each isotope's mass multiplied by its fractional abundance. On the AP exam, you will encounter both the 'calculate the average atomic mass' direction and the reverse—given the average atomic mass, determine an unknown abundance.
WEIGHTED AVERAGE ATOMIC MASS
where M̄ = average atomic mass (u), mᵢ = exact mass of isotope i (u), fᵢ = fractional abundance of isotope i (dimensionless, 0 ≤ fᵢ ≤ 1), and Σfᵢ = 1.
FRACTIONAL ABUNDANCE FROM PERCENT
Mass spectra often report abundances as percentages; dividing by 100 converts them to the fractional form needed for the weighted average calculation.
TWO-ISOTOPE SYSTEM (SOLVING FOR UNKNOWN ABUNDANCE)
When an element has exactly two isotopes with known masses and a known average atomic mass, let x = fractional abundance of isotope 1. Then the abundance of isotope 2 is (1 − x). Solve the single linear equation for x.
AP Exam Tip
SECTION 5
Interpreting Multi-Isotope Spectra
While chlorine's two-isotope spectrum is the classic introductory example, many elements display more complex isotopic patterns. Elements like tin (Sn) have ten stable isotopes, producing a forest of peaks on the mass spectrum, while others like fluorine (19F, 100% abundance) show a single peak—these are called monoisotopic elements. The spectrum below illustrates a three-isotope system for magnesium (Mg), which provides a richer interpretive challenge.
Notice a critical qualitative pattern: the weighted average atomic mass of magnesium (24.31 u) falls very close to 24—the mass of the most abundant isotope—rather than near the arithmetic center of the range (25). This is a reliable rule of thumb for quickly checking your calculations: the average should always be pulled toward the most abundant isotope. When reading a mass spectrum on the AP exam, you can immediately estimate the average atomic mass by observing which peak is tallest and expecting the average to be near that value.
| Element | Number of Stable Isotopes | Most Abundant Isotope | Avg Atomic Mass (u) |
|---|---|---|---|
| Hydrogen | 2 (+ tritium, radioactive) | ¹H (99.98%) | 1.008 |
| Carbon | 2 | ¹²C (98.93%) | 12.011 |
| Chlorine | 2 | ³⁵Cl (75.77%) | 35.45 |
| Magnesium | 3 | ²⁴Mg (78.99%) | 24.31 |
| Tin | 10 | ¹²⁰Sn (32.58%) | 118.71 |
Examples of elements and their isotopic complexity
SECTION 6
Worked Example: Calculating Average Atomic Mass
The following example walks through a complete calculation of the average atomic mass of copper from mass spectrum data—the exact type of problem you will encounter on the AP Chemistry exam.
Average Atomic Mass of Copper from Mass Spectrum Data
- 1
Step 1 — Extract Data from the Spectrum
A mass spectrum of naturally occurring copper shows two peaks. The peak at m/z = 63 has a relative abundance of 69.17%, and the peak at m/z = 65 has a relative abundance of 30.83%. These two values must sum to 100%, which they do (69.17 + 30.83 = 100.00), confirming we have accounted for all naturally occurring isotopes. - 2
Step 2 — Convert Percentages to Fractional Abundances
Divide each percentage by 100 to obtain the fractional abundance used in the weighted average formula.f₆₃ = 69.17 / 100 = 0.6917; f₆₅ = 30.83 / 100 = 0.3083 - 3
Step 3 — Apply the Weighted Average Formula
Multiply each isotope's mass number by its fractional abundance and sum the products. M̄ = (63 × 0.6917) + (65 × 0.3083) = 43.577 + 20.040 = 63.617 u. On the AP exam, the mass numbers (63, 65) are used unless exact isotopic masses are provided.M̄ ≈ 63.62 u - 4
Step 4 — Verify Against the Periodic Table
The periodic table lists copper's atomic mass as 63.55 u. Our result of 63.62 u is very close; the small discrepancy arises because we used integer mass numbers rather than exact isotopic masses (62.9296 u and 64.9278 u). Using exact masses: (62.9296 × 0.6917) + (64.9278 × 0.3083) = 43.529 + 20.017 = 63.546 u ≈ 63.55 u.Exact calculation: M̄ = 63.55 u ✓
CALCULATION CHECKLIST
SECTION 7
Common Exam Pitfalls & Strategies
Mass spectra questions on the AP Chemistry exam can take several forms: straightforward calculation, reverse-engineering an unknown abundance, identifying an element from its spectrum, or qualitative reasoning about where the average must fall. Understanding the common pitfalls gives you a strategic advantage.
| Common Mistake | Why It's Wrong | Correct Approach |
|---|---|---|
| Taking a simple average of isotope masses | Ignores relative abundances; (35 + 37)/2 = 36 ≠ 35.45 for Cl | Use the weighted average formula: Σ(mᵢ × fᵢ) |
| Forgetting to convert % to fractions | Multiplying mass × percent gives values 100× too large | Divide % by 100 before multiplying, or divide the final sum by 100 |
| Confusing mass number with atomic mass | Mass number (A) is always an integer; atomic mass includes nuclear binding energy differences | Use mass numbers unless exact isotopic masses are given in the problem |
| Average outside the isotope mass range | Mathematically impossible for a weighted average to exceed the range of its components | Always sanity-check: M̄ must lie between the lightest and heaviest isotope masses |
| Assuming abundances sum to something other than 100% | Incomplete data leads to an incorrect weighted average | Verify Σfᵢ = 1 (or Σ%ᵢ = 100%) before calculating |
Common errors on AP mass spectrum questions and how to avoid them
EXAM STRATEGY
SECTION 8
Connections to Advanced Mass Spectrometry
The elemental mass spectra you analyze in AP Chemistry represent the simplest application of mass spectrometry. In more advanced courses and in professional research settings, the technique is extended to molecules, proteins, and even whole cells. Understanding the foundations laid here—ionization, mass-to-charge separation, and abundance measurement—prepares you for these broader applications.
| Feature | AP Chemistry (Elemental MS) | Advanced Applications (Molecular MS) |
|---|---|---|
| Sample type | Pure elements (individual atoms) | Molecules, biomolecules, mixtures |
| Peaks represent | Individual isotopes of one element | Molecular ions, fragment ions, multiply charged species |
| Charge (z) | Typically z = 1 (singly charged) | Often z > 1 (multiply charged proteins) |
| Information extracted | Isotopic abundances, average atomic mass | Molecular mass, structure, fragmentation pathways |
| Ionization method | Electron impact (simple) | ESI, MALDI, and other soft ionization techniques |
AP-level versus advanced mass spectrometry
In organic chemistry and biochemistry, you will encounter fragmentation patterns in which a molecule breaks apart inside the mass spectrometer, producing a spectrum with many peaks corresponding to fragment ions. The molecular ion peak (M⁺) indicates the intact molecule's mass, while other peaks serve as a molecular fingerprint. For now, the AP exam limits itself to elemental spectra, but the reasoning skills you develop—reading bar heights, calculating weighted averages, and relating spectra to composition—transfer directly to these more complex scenarios.
SECTION 9
Practice Problems
Question 1: CONCEPTUAL
- A. Element X has an average atomic mass of exactly 27.00 u and only one naturally occurring isotope.
- B. Element X has two isotopes whose average mass equals 27.
- C. Element X has an atomic number of 27.
- D. The mass spectrometer failed to detect the minor isotopes of element X.
Show answer (A)
Question 2: BASIC CALCULATION
- A. 10.5 u
- B. 10.8 u
- C. 11.0 u
- D. 10.2 u
Show answer (B)
Question 3: INTERMEDIATE
- A. Silicon; M̄ ≈ 28.09 u
- B. Phosphorus; M̄ ≈ 29.00 u
- C. Silicon; M̄ ≈ 29.00 u
- D. Aluminum; M̄ ≈ 28.09 u
Show answer (A)
Question 4: APPLIED
5 ptsShow answer
Question 5: CRITICAL THINKING
5 ptsShow answer
SUMMARY
Summary & Key Concepts
Summary
A mass spectrum separates the isotopes of an element by mass-to-charge ratio (m/z), plotted on the x-axis, against relative abundance on the y-axis. Each peak corresponds to one isotope, and the height of the peak indicates how prevalent that isotope is in nature. The weighted average atomic mass is calculated by summing the product of each isotope's mass and its fractional abundance: M̄ = Σ(mᵢ × fᵢ). This quantity is exactly the atomic mass reported on the periodic table.
When interpreting mass spectra, remember three guiding principles. First, the average must fall between the lightest and heaviest isotope masses. Second, the average is pulled toward the most abundant isotope. Third, a single-peak spectrum indicates a monoisotopic element whose atomic mass equals the mass of its sole stable isotope. Master these ideas, and you will be prepared to tackle any mass spectrum question on the AP Chemistry exam.