
SECTION 1
Historical Context & Motivation
The concept of chemical buffering arose from a practical problem: biological and industrial processes often require pH stability, yet adding even small quantities of strong acid or base to pure water causes enormous pH swings. Early physiologists noticed that blood resists pH change far more effectively than simple salt solutions, prompting systematic investigation into why certain mixtures stabilize hydrogen-ion concentration. The quantitative treatment of this resistance—what we now call buffer capacity—developed over roughly a century of work linking equilibrium theory with real-world applications in medicine, environmental science, and manufacturing.
1884 • Arrhenius Acid–Base Theory
1908 • Henderson's Buffer Equation
1916 • Hasselbalch Logarithmic Form
1922 • Van Slyke's Buffer Index
1966 • Buffer Design in Biochemistry
Knowing that a buffer resists pH change is only part of the story. The deeper question—and the one the AP exam expects you to answer—is how much strong acid or base can a particular buffer absorb before it effectively fails? That question drives the entire discussion of buffer capacity.
SECTION 2
Core Principles & Definitions
Before quantifying buffer capacity, it is essential to distinguish it from the mere existence of a buffer. A buffer solution contains a weak acid and its conjugate base (or a weak base and its conjugate acid) in appreciable concentrations. The Henderson–Hasselbalch equation tells us the pH of such a mixture, but it says nothing about how much perturbation the system can withstand. Buffer capacity fills that gap: it measures the quantitative resistance of a buffer to pH change upon addition of strong acid or base.
Buffer Capacity (β)
Dependence on Concentration
Dependence on Ratio
Effective Buffer Range
SECTION 3
Visual Explanation — Buffer Capacity Curve
The diagram above reveals the central insight of buffer capacity: it is not a fixed property of a solution but rather a function of pH. At the peak (pH = pKₐ), the buffer contains equal moles of weak acid and conjugate base, so it can neutralize added strong acid and strong base with equal efficiency. As the pH drifts away from pKₐ, one component becomes scarce relative to the other, and the capacity drops. Beyond roughly ±1 pH unit from pKₐ, the minor component is so depleted that the buffer provides negligible resistance and effectively fails.
SECTION 4
Mathematical Framework
Two equations are central to buffer-capacity problems on the AP exam. The first is the Henderson–Hasselbalch equation, which predicts buffer pH; the second is the Van Slyke expression for buffer capacity itself.
HENDERSON–HASSELBALCH EQUATION
pKₐ = −log Kₐ of the weak acid; [A⁻] = concentration (or moles) of conjugate base; [HA] = concentration (or moles) of weak acid. This equation is valid when the x-is-small approximation holds, i.e., Kₐ is small relative to initial concentrations.
VAN SLYKE BUFFER CAPACITY
β = buffer capacity (mol L⁻¹ pH⁻¹); C = total buffer concentration ([HA] + [A⁻]); Kₐ = acid dissociation constant; [H⁺] = hydrogen-ion concentration. At pH = pKₐ, [H⁺] = Kₐ, and this simplifies to β_max = 2.303 × C / 4 ≈ 0.576 C.
MAXIMUM BUFFER CAPACITY
This maximum occurs when pH = pKₐ. For a 1.00 M total buffer, β_max ≈ 0.576 mol L⁻¹ pH⁻¹. Practically, this means about 0.58 mol of strong acid or base per liter is needed to shift the pH by one unit.
SECTION 5
Factors Affecting Buffer Capacity
The bar charts crystallize the two independent levers that control buffer capacity. First, total buffer concentration (C) acts as a simple multiplier: doubling C doubles β because there are twice as many moles available to react with added strong acid or base. Second, the [A⁻]/[HA] ratio governs how symmetrically the buffer can respond. At a 1:1 ratio, both the acid and base reservoirs are equally stocked; at a 10:1 ratio the acid reservoir is nearly empty, so even a small addition of strong base can consume the remaining HA and crash the buffer. The AP exam frequently presents scenarios where you must identify which of two buffers has greater capacity, and the answer almost always hinges on these two factors.
| Factor | Effect on β | Exam Strategy |
|---|---|---|
| ↑ Total concentration C | β increases proportionally (β ∝ C) | Compare moles of HA + A⁻ available in each buffer |
| [A⁻]/[HA] → 1 | β maximized (β_max = 0.576 C) | Check if pH ≈ pKₐ; if yes, capacity is at its peak |
| [A⁻]/[HA] → 10 or 0.1 | β reduced to ~43% of max | Buffer near edge of effective range; less capacity on one side |
| Volume of buffer | More volume → more moles at same concentration | Compare moles, not just molarity, when volumes differ |
Summary of factors affecting buffer capacity
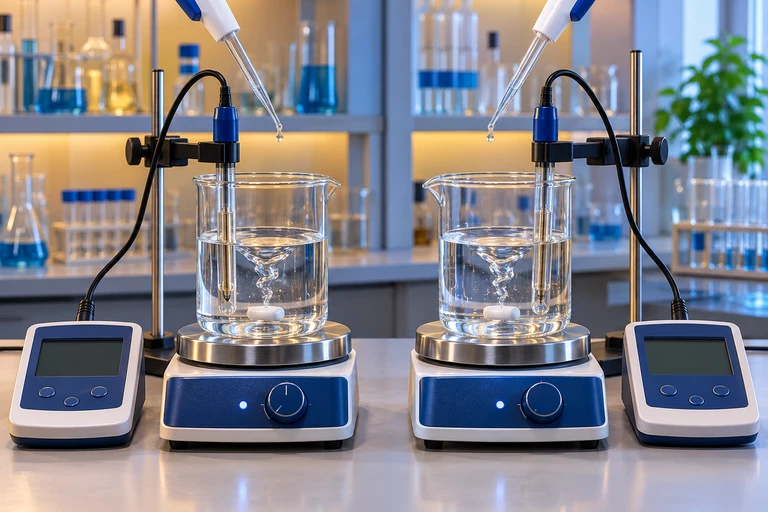 Compare two 100 mL acetic-acid buffers with pKa = 4.76 and a tenfold difference in total concentration. Adding 0.50 mmol HCl changes their pH from about 4.76 to 4.72 and 4.29, respectively, when the added volume is negligible.
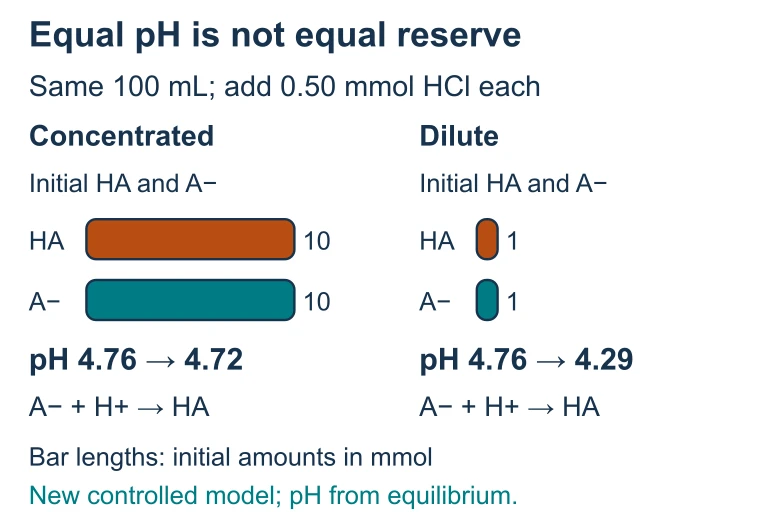 Compare two 100 mL acetic-acid buffers with pKa = 4.76 and a tenfold difference in total concentration. Adding 0.50 mmol HCl changes their pH from about 4.76 to 4.72 and 4.29, respectively, when the added volume is negligible.
SECTION 6
Worked Example
Worked example
- 1
Step 1 — Identify the Two Buffers
Buffer A: 500.0 mL of 0.200 M CH₃COOH and 0.200 M CH₃COO⁻ (total C = 0.400 M). Buffer B: 500.0 mL of 0.100 M CH₃COOH and 0.300 M CH₃COO⁻ (total C = 0.400 M). Both use acetic acid, pKₐ = 4.74.Both buffers have the same total concentration (0.400 M) and same volume. - 2
Step 2 — Calculate pH of Each Buffer
Using Henderson–Hasselbalch: Buffer A: pH = 4.74 + log(0.200/0.200) = 4.74 + 0 = 4.74. Buffer B: pH = 4.74 + log(0.300/0.100) = 4.74 + log(3.00) = 4.74 + 0.477 = 5.22.pH_A = 4.74; pH_B = 5.22 - 3
Step 3 — Determine Which Has Greater Buffer Capacity
Since C is identical for both, the deciding factor is the [A⁻]/[HA] ratio. Buffer A has a ratio of 1:1 (pH = pKₐ), placing it at the peak of the capacity curve. Buffer B has a ratio of 3:1, which is 0.48 pH units from pKₐ—still within the effective range but below maximum.Buffer A has greater overall buffer capacity because its ratio is 1:1. - 4
Step 4 — Quantify: How Many Moles of NaOH Can Each Buffer Absorb Before pH Exceeds 5.74?
When NaOH is added it converts HA → A⁻. Let n = moles NaOH added. Initial moles in 0.500 L: Buffer A has 0.100 mol HA and 0.100 mol A⁻; Buffer B has 0.050 mol HA and 0.150 mol A⁻. At pH = 5.74: [A⁻]/[HA] = = 10. After adding n mol NaOH: Buffer A → (0.100 + n)/(0.100 − n) = 10, solving gives n = 0.0818 mol. Buffer B → (0.150 + n)/(0.050 − n) = 10, solving gives n = 0.0364 mol.Buffer A absorbs 0.082 mol NaOH vs. Buffer B's 0.036 mol NaOH before reaching pH 5.74—more than double. - 5
Step 5 — Interpret the Result
Although both buffers have the same total concentration and volume, the 1:1 ratio in Buffer A gives it nearly symmetric capacity against both acid and base. Buffer B, with a 3:1 excess of A⁻, has relatively little HA left; strong base depletes the small HA reservoir quickly. This example illustrates why buffer capacity depends on both C and the ratio, and why pH = pKₐ is optimal.
SECTION 7
Strengths & Limitations of Buffers
| Aspect | Strength | Limitation |
|---|---|---|
| pH Stability | Maintains nearly constant pH against moderate additions of strong acid or base | Capacity is finite; once one component is consumed, pH changes abruptly |
| Predictability | Henderson–Hasselbalch allows accurate pH prediction given concentrations | Assumes dilute ideal-solution behavior; fails at high ionic strength without activity corrections |
| Tunability | Choosing a weak acid whose pKₐ matches the target pH yields maximum capacity | No single buffer covers the full pH range; different acids needed for different ranges |
| Biological Use | Blood bicarbonate buffer maintains pH 7.35–7.45 critical for enzyme function | Temperature changes shift Kₐ and therefore pH, requiring recalibration of buffer recipes |
Strengths and limitations of buffer systems
SECTION 8
Connection to Titration Curves & Advanced Theory
Buffer capacity connects directly to the shape of a titration curve. The flat, gently sloping region near the half-equivalence point on a weak-acid/strong-base titration is precisely where buffer capacity is high. The steep rise near the equivalence point corresponds to a region of near-zero buffer capacity, because essentially all of one component has been consumed. Understanding this link allows you to read a titration curve and instantly assess buffer capacity at any point.
| Concept | AP-Level Treatment | Advanced / College Treatment |
|---|---|---|
| Buffer Capacity | Qualitative: higher C and ratio closer to 1 → greater capacity. Moles-based stoichiometric reasoning. | Quantitative: Van Slyke equation β = dCb/dpH; integration to compute exact moles tolerable for a given ΔpH. |
| Activity Effects | Assumed negligible; ideal dilute solutions. | Debye–Hückel corrections for ionic strength alter effective Kₐ and shift the optimal buffer pH. |
| Polyprotic Buffers | Treated as separate equilibria; pick the pKₐ closest to target pH. | Overlapping equilibria contribute additive buffer capacity, modeled as sum of individual β curves. |
| Buffer in Blood | CO₂/HCO₃⁻ system with respiratory regulation. | Open system: CO₂ partial pressure is regulated by lungs, creating a non-equilibrium but steady-state buffer with anomalously high capacity. |
Buffer capacity at the AP level versus advanced treatments
In a general or analytical chemistry course, you will encounter the formal derivative β = dCb/dpH, where Cb is the concentration of strong base added. This derivative form makes clear that buffer capacity is the slope of the titration curve inverted: where the titration curve is flat (small dpH/dCb), buffer capacity is large, and vice versa. This elegant connection unifies two major AP topics—buffers and titrations—into a single mathematical picture.
SECTION 9
Practice Problems
Question 1: CONCEPTUAL
- A. Buffer X, because its pH equals pKₐ, maximizing the ratio factor enough to outweigh the lower concentration
- B. Buffer Y, because its higher total concentration outweighs the non-ideal ratio
- C. They have equal capacity because the effects cancel
- D. Buffer X, because pH 7.00 is outside the effective buffer range
Show answer (A)
Question 2: BASIC CALCULATION
- A. 4.58
- B. 4.74
- C. 4.89
- D. 5.22
Show answer (C)
Question 3: INTERMEDIATE
- A. 0.036 mol
- B. 0.182 mol
- C. 0.327 mol
- D. 0.400 mol
Show answer (C)
Question 4: APPLIED
Show answer
Question 5: CRITICAL THINKING