

SECTION 1
Historical Context & Motivation
Long before modern spectrophotometers could be purchased from a catalog, scientists grappled with a deceptively simple question: how does the intensity of light change as it passes through a colored solution? The answer to this question would eventually transform analytical chemistry, enabling researchers to determine the concentration of a dissolved substance without isolating or weighing it. The Beer-Lambert Law is the mathematical relationship that emerged from over a century of careful experimentation, linking the absorption of light to both the concentration and the path length of an absorbing medium. Understanding its historical development reveals how empirical observation, combined with rigorous mathematical description, produces the quantitative tools that underpin modern chemistry.
1729 • Bouguer's Observation
1760 • Lambert's Formalization
1852 • Beer's Extension
1940s • Beckman Spectrophotometer
The central question these scientists pursued can be stated concisely: given a beam of monochromatic light passing through a solution, how can we predict the fraction of light that reaches the detector? And, critically, how can we reverse that calculation to determine the unknown concentration of an analyte from a simple absorbance measurement? The Beer-Lambert Law provides the elegant and quantitative answer.
SECTION 2
Core Principles & Definitions
The Beer-Lambert Law rests on several interconnected physical ideas. When a beam of light encounters a solution containing an absorbing species, three things may happen to each photon: it may pass through unaffected (transmission), it may be absorbed by a solute molecule (absorption), or it may be scattered. The Beer-Lambert Law specifically models the absorption process, assuming scattering is negligible. The fundamental idea is that each successive thin layer of solution removes the same fraction of the remaining light, which produces an exponential decay in intensity—transformed by the logarithm into a convenient linear relationship.
Absorbance (A)
Transmittance (T)
Molar Absorptivity (ε)
Path Length (b)
Monochromatic Light
KEY TAKEAWAY
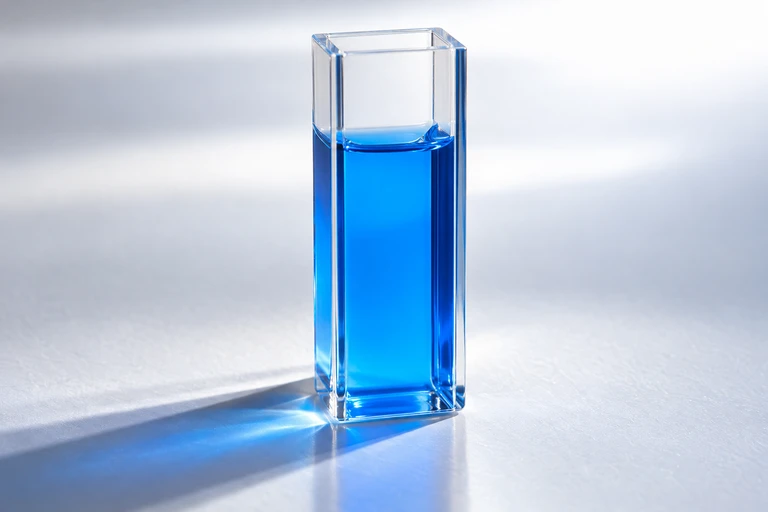 A blue solution transmits some visible wavelengths more strongly than others; its absorption depends on wavelength.
SECTION 3
Visual Explanation
Light Passing Through a Cuvette
In the diagram above, notice how the beam visually narrows as it passes through the sample—this represents the decrease in light intensity. Each violet circle represents an absorbing molecule; increasing the number of these molecules (raising concentration c) or increasing the distance the light must travel through them (raising path length b) both increase the total amount of light absorbed. The key insight is that absorbance A, not the raw intensity ratio, is the quantity that scales linearly with concentration—which is precisely why chemists measure absorbance rather than transmittance when constructing calibration curves.
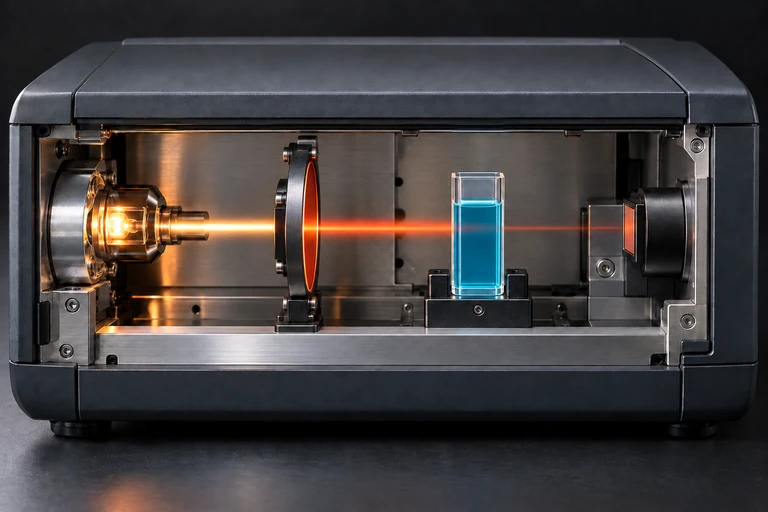 A photometer directs selected light through a cuvette and measures the transmitted light at a detector.
SECTION 4
Mathematical Framework
The Beer-Lambert Law is derived from the observation that each infinitesimally thin layer of solution absorbs the same fraction of light that enters it. If the intensity at depth x is I(x), then the decrease dI over an additional thickness dx is proportional to I(x) itself, to the concentration c of absorbing species, and to a proportionality constant α: dI = −α·c·I·dx. Integrating from x = 0 to x = b yields an exponential decay, which is conventionally expressed as a base-10 logarithm to give the familiar linear form.
TRANSMITTANCE
where I = transmitted light intensity and I₀ = incident light intensity. T is dimensionless, ranging from 0 to 1.
ABSORBANCE DEFINITION
Absorbance A is dimensionless. When T = 1 (no absorption), A = 0. When T = 0.1 (90% absorbed), A = 1. When T = 0.01 (99% absorbed), A = 2.
BEER-LAMBERT LAW
ε = molar absorptivity (L·mol⁻¹·cm⁻¹), b = path length (cm), c = molar concentration (mol·L⁻¹). This is the central equation: absorbance is directly proportional to both concentration and path length.
SOLVING FOR CONCENTRATION
This rearrangement is the most common form used in analytical chemistry. By measuring A and knowing ε (from literature or a calibration curve) and b (from the cuvette), the unknown concentration can be calculated directly.
Unit Analysis
SECTION 5
Calibration Curves & Data Analysis
In practice, chemists rarely rely on a single absorbance reading and a literature value of ε to determine an unknown concentration. Instead, they construct a calibration curve (also called a standard curve or Beer's Law plot) by measuring the absorbance of several solutions of known concentration—called standard solutions. When absorbance is plotted on the y-axis against concentration on the x-axis, the Beer-Lambert Law predicts a straight line passing through the origin with slope equal to εb. A best-fit line (linear regression) through the data points allows one to read off the concentration of any unknown sample from its measured absorbance, or to extract ε from the slope when b = 1.00 cm.
The calibration curve above illustrates the standard analytical workflow. Four solutions of known concentration were prepared, their absorbances measured at the wavelength of maximum absorption (λmax), and the points plotted. The best-fit line has slope εb, and its linearity confirms Beer-Lambert behavior within this concentration range. The unknown sample's absorbance is measured, then interpolated from the calibration curve to yield its concentration. Measuring at λmax maximizes sensitivity because ε is greatest at this wavelength, producing the steepest possible calibration slope and thus the smallest uncertainty in the determined concentration.
AP Exam Tip
SECTION 6
Worked Example
The following worked example demonstrates a typical Beer-Lambert calculation you might encounter on the AP Chemistry exam or in a college analytical chemistry laboratory.
Determining the Concentration of KMnO₄
- 1
Step 1 — Identify Given Values
A potassium permanganate (KMnO₄) solution is measured at 525 nm using a standard 1.00 cm cuvette. The spectrophotometer reads an absorbance of A = 0.740. The molar absorptivity of KMnO₄ at 525 nm is ε = 2,455 L·mol⁻¹·cm⁻¹. We need to find the molar concentration c.A = 0.740, ε = 2,455 L·mol⁻¹·cm⁻¹, b = 1.00 cm - 2
Step 2 — Write the Beer-Lambert Equation
The Beer-Lambert Law states A = εbc. We rearrange to solve for concentration: c = A / (ε × b). - 3
Step 3 — Substitute Values
Substituting the known values: c = 0.740 / (2,455 L·mol⁻¹·cm⁻¹ × 1.00 cm). - 4
Step 4 — Calculate and Verify Units
c = 0.740 / 2,455 = 3.015 × 10⁻⁴ mol·L⁻¹. The units work out: dimensionless / (L·mol⁻¹·cm⁻¹ × cm) = mol·L⁻¹ = M. Rounding to three significant figures (matching the precision of A), c ≈ 3.02 × 10⁻⁴ M.c ≈ 3.02 × 10⁻⁴ mol·L⁻¹ - 5
Step 5 — Reasonableness Check
An absorbance of 0.740 corresponds to a transmittance of T = 10⁻⁰·⁷⁴⁰ ≈ 0.182, meaning about 18% of the incident light is transmitted. This is a moderately absorbing solution, consistent with a dilute (sub-millimolar) KMnO₄ concentration, which appears light purple—reasonable for ≈ 3 × 10⁻⁴ M.
SECTION 7
Assumptions, Strengths & Limitations
The Beer-Lambert Law is remarkably powerful, but it rests on several assumptions that, when violated, lead to deviations from linearity. Understanding these limitations is essential not only for the AP exam but also for designing reliable experiments in the laboratory. Deviations are classified as fundamental (inherent to the law itself), chemical (arising from the chemistry of the analyte), or instrumental (caused by the spectrophotometer itself).
| Category | Assumption of Beer-Lambert Law | What Causes Deviation |
|---|---|---|
| Fundamental | Dilute solutions (absorber–absorber interactions are negligible) | At high concentrations (> ~0.01 M), solute molecules interact, changing the effective ε. The A vs. c plot curves downward. |
| Chemical | The analyte exists in a single absorbing form | pH-dependent equilibria, dimerization, or complexation alter the distribution of absorbing species, changing the apparent ε. |
| Instrumental | Monochromatic light source | A wide spectral bandwidth means ε varies across the light reaching the sample; this produces negative deviations, especially where the absorption spectrum changes rapidly. |
| Instrumental | No scattering or reflection losses | Turbid or colloidal solutions scatter light, inflating apparent absorbance. Dirty cuvette surfaces cause stray reflection. |
| Instrumental | Stray light is negligible | Stray light (light reaching the detector without passing through the sample) sets an upper limit on measurable absorbance, typically A ≈ 2–3. |
Common sources of deviation from Beer-Lambert linearity
PRACTICAL GUIDELINE
SECTION 8
Connections to Advanced Spectroscopy
The Beer-Lambert Law, as introduced in AP Chemistry, applies specifically to UV-visible absorption spectroscopy of solutions. However, the same underlying principle—that absorbance is proportional to the number of absorbing species in the optical path—extends across a wide range of spectroscopic and analytical techniques encountered in advanced coursework and research. Recognizing these connections helps situate the Beer-Lambert Law as a foundational quantitative tool rather than an isolated formula.
| Feature | AP Chemistry (Beer-Lambert) | Advanced Techniques |
|---|---|---|
| Wavelength range | UV-visible (190–800 nm) | IR spectroscopy uses the same law for infrared wavelengths; X-ray absorption spectroscopy applies similar principles at much shorter wavelengths. |
| Sample phase | Solution (liquid) | Gas-phase spectroscopy uses the same form, substituting partial pressure or number density for molarity. Atmospheric remote sensing relies on this approach. |
| Multi-component | Single absorbing species | Additivity of absorbances: A_total = ε₁bc₁ + ε₂bc₂ + ··· allows simultaneous determination of multiple analytes at different wavelengths via matrix algebra. |
| Quantitative output | Single concentration value | Reaction kinetics: absorbance measured over time gives concentration vs. time data, enabling rate law determination—a direct connection to AP Chemistry Unit 5. |
Beer-Lambert Law in AP Chemistry vs. advanced spectroscopic applications
One particularly important connection for AP Chemistry students is the use of spectrophotometry to monitor reaction rates. Because absorbance is proportional to concentration, measuring A at regular time intervals provides a real-time concentration profile without needing to withdraw and analyze samples. This technique is central to laboratory experiments on reaction kinetics and appears frequently on AP exam free-response questions that integrate spectroscopy with rate law analysis.
SECTION 9
Practice Problems
Question 1: CONCEPTUAL
- A. The absorbance of X is four times the absorbance of Y because absorbance depends on the square of the concentration.
- B. The absorbance of X is twice the absorbance of Y because absorbance is directly proportional to concentration.
- C. The absorbance of X is half the absorbance of Y because a more concentrated solution transmits more light.
- D. The absorbances of X and Y are equal because ε and b are the same for both solutions.
Show answer (B)
Question 2: BASIC CALCULATION
- A. 0.0143 M
- B. 0.0700 M
- C. 1.82 M
- D. 0.700 M
Show answer (B)
Question 3: INTERMEDIATE
- A. 620 L·mol⁻¹·cm⁻¹
- B. 1,240 L·mol⁻¹·cm⁻¹
- C. 2,480 L·mol⁻¹·cm⁻¹
- D. 310 L·mol⁻¹·cm⁻¹
Show answer (A)
Question 4: APPLIED
4 ptsShow answer
Question 5: CRITICAL THINKING
4 ptsShow answer
SUMMARY
Beer-Lambert Law — Summary
Summary
The Beer-Lambert Law establishes that absorbance (A) is directly proportional to the product of molar absorptivity (ε), path length (b), and concentration (c), expressed as A = εbc. Transmittance (T = I/I₀) is the fraction of light passing through the sample, and absorbance is its negative base-10 logarithm. Because absorbance scales linearly with concentration, a calibration curve (A vs. c) allows determination of unknown concentrations by interpolation.
The law holds under specific conditions: dilute solutions, monochromatic light, no scattering, and a single absorbing species. Deviations arise at high concentrations, with polychromatic sources, or when chemical equilibria shift the identity of the absorber. For reliable measurements, keep absorbance between 0.1 and 1.0. On the AP Chemistry exam, expect questions that require calculating concentration from absorbance data, interpreting calibration curves, extracting molar absorptivity from slope data, and connecting spectrophotometry to reaction kinetics.