
SECTION 1
Historical Context & Motivation
The need to determine the exact concentration of an acid or base in solution has driven chemical analysis for centuries. Before modern instrumentation, chemists relied on volumetric methods—carefully measuring the volume of a solution of known concentration required to react completely with an unknown. Acid-base titration emerged as the most widely practiced of these volumetric techniques, enabling quantitative work in pharmacy, water treatment, food science, and industrial chemistry. The method's elegance lies in its simplicity: a measured volume of titrant (a solution of precisely known concentration) is added to an analyte (the unknown) until the reaction reaches its stoichiometric equivalence point.
1729 • First Volumetric Analysis
1835 • Gay-Lussac Standardizes Titrations
1894 • Ostwald's Indicator Theory
1909 • Sørensen Defines pH
Today, acid-base titrations remain a cornerstone of analytical chemistry—not merely as a historical curiosity, but as a practical tool that directly illustrates stoichiometry, equilibrium, and pH in a single experiment. The central question the technique addresses is deceptively simple: How much acid or base is actually present in a sample? Answering it requires mastery of neutralization stoichiometry, buffer chemistry, and the interpretation of titration curves.
SECTION 2
Core Principles & Definitions
An acid-base titration is built on the reaction between a Brønsted–Lowry acid (proton donor) and a Brønsted–Lowry base (proton acceptor). The titrant is delivered from a buret into a flask containing the analyte. A standard solution is one whose concentration has been determined to high precision, often by primary-standard titration. The point at which stoichiometrically equivalent amounts of acid and base have been combined is the equivalence point, while the end point is the experimentally observed signal—usually an indicator color change or a sharp jump on a pH meter—that approximates it.
Equivalence Point
Half-Equivalence Point
Indicator Selection
Buffer Region
SECTION 3
Titration Curve — Visual Explanation
The most informative representation of a titration is the titration curve, a plot of solution pH versus volume of titrant added. Two canonical cases—strong acid/strong base and weak acid/strong base—illustrate fundamentally different curve shapes and equivalence-point pH values.
Several features of this curve are critical for the AP exam. Before any titrant is added, the pH reflects the initial concentration of the strong acid. As NaOH is added, the excess H⁺ concentration decreases gradually, producing a relatively flat region. Near the equivalence point, the curve steepens dramatically—a hallmark that allows indicators to signal the end point. After equivalence, excess OH⁻ controls the pH, and the curve flattens again. For strong acid–strong base titrations, the equivalence-point pH is always 7.00 at 25 °C because the salt produced (NaCl) does not hydrolyze.
SECTION 4
Mathematical Framework
The quantitative backbone of every titration calculation is the mole relationship at the equivalence point. For a monoprotic acid–monoprotic base reaction, the stoichiometry is 1 : 1, and the central equation is straightforward.
EQUIVALENCE-POINT STOICHIOMETRY
Ma = molarity of acid, Va = volume of acid, Mb = molarity of base, Vb = volume of base. For polyprotic acids or polyhydroxy bases, multiply each side by the appropriate stoichiometric coefficient.
HENDERSON–HASSELBALCH EQUATION
Applies in the buffer region of a weak acid / strong base titration. At the half-equivalence point, [A⁻] = [HA], so log(1) = 0 and pH = pKₐ.
pH AT EQUIVALENCE (WEAK ACID / STRONG BASE)
At equivalence, only the conjugate base A⁻ remains in solution at concentration Csalt. It hydrolyzes, so the equivalence-point pH is above 7 for weak acid / strong base titrations.
SECTION 5
Titration Curve Classification
The shape and key features of a titration curve depend on whether the analyte and titrant are strong or weak. Recognizing these curve types at a glance is essential for the AP exam. The diagram below contrasts the weak acid / strong base curve with the strong acid / strong base curve to highlight the buffer region and the shifted equivalence-point pH.
| Titration Type | Initial pH | Equiv. Pt. pH | Suitable Indicator |
|---|---|---|---|
| Strong acid / Strong base | Very low (≈ 1) | 7.00 | Bromothymol blue (6.0–7.6) |
| Weak acid / Strong base | Moderate (≈ 2–5) | > 7 (basic) | Phenolphthalein (8.2–10.0) |
| Strong acid / Weak base | High (≈ 10–13) | < 7 (acidic) | Methyl red (4.4–6.2) |
| Weak acid / Weak base | Variable | ≈ 7 (if Kₐ ≈ Kb) | No sharp break; not titrated with indicators |
Summary of titration curve characteristics by acid-base strength
SECTION 6
Worked Example — Weak Acid / Strong Base
A 25.00 mL sample of 0.200 M acetic acid (CH₃COOH, Kₐ = 1.8 × 10⁻⁵) is titrated with 0.100 M NaOH. Determine the pH (a) initially, (b) after adding 25.00 mL of NaOH (half-equivalence), (c) at the equivalence point, and (d) after adding 55.00 mL of NaOH.
Worked example
- 1
Step 1 — Determine the equivalence-point volume
Moles of CH₃COOH = 0.02500 L × 0.200 M = 0.00500 mol. At equivalence, moles NaOH = moles acid = 0.00500 mol. Volume of NaOH = 0.00500 mol ÷ 0.100 M = 0.05000 L = 50.00 mL.V(eq) = 50.00 mL NaOH - 2
Step 2 — Initial pH (0 mL NaOH added)
Only weak acid is present. Set up the ICE table: Kₐ = x² / (0.200 − x) ≈ x² / 0.200. Solving: x = √(1.8 × 10⁻⁵ × 0.200) = √(3.6 × 10⁻⁶) = 1.90 × 10⁻³ M. pH = −log(1.90 × 10⁻³) = 2.72. The 5% approximation check: (1.90 × 10⁻³ / 0.200) × 100% = 0.95%, valid.pH = 2.72 - 3
Step 3 — Half-equivalence point (25.00 mL NaOH)
Moles NaOH added = 0.02500 L × 0.100 M = 0.00250 mol, which neutralizes exactly half the acid. Remaining CH₃COOH = 0.00250 mol; CH₃COO⁻ produced = 0.00250 mol. Since [HA] = [A⁻], the Henderson–Hasselbalch equation gives pH = pKₐ + log(1) = pKₐ = −log(1.8 × 10⁻⁵) = 4.74.pH = pKₐ = 4.74 - 4
Step 4 — Equivalence point (50.00 mL NaOH)
All acid has been converted to CH₃COO⁻. Total volume = 25.00 + 50.00 = 75.00 mL = 0.07500 L. [CH₃COO⁻] = 0.00500 mol / 0.07500 L = 0.0667 M. The acetate ion hydrolyzes: Kb = Kw / Kₐ = 1.0 × 10⁻¹⁴ / 1.8 × 10⁻⁵ = 5.56 × 10⁻¹⁰. [OH⁻] = √(5.56 × 10⁻¹⁰ × 0.0667) = √(3.71 × 10⁻¹¹) = 6.09 × 10⁻⁶ M. pOH = 5.22; pH = 14.00 − 5.22 = 8.78.pH = 8.78 (basic, as expected) - 5
Step 5 — Post-equivalence (55.00 mL NaOH)
Excess NaOH = (0.05500 − 0.05000) L × 0.100 M = 0.000500 mol. Total volume = 0.08000 L. [OH⁻] = 0.000500 / 0.08000 = 6.25 × 10⁻³ M. pOH = −log(6.25 × 10⁻³) = 2.20. pH = 14.00 − 2.20 = 11.80. In the post-equivalence region, the excess strong base dominates and the hydrolysis contribution is negligible.pH = 11.80
SECTION 7
Indicators vs. pH Meter Methods
Two primary methods exist for detecting the end point of a titration: visual indicators and potentiometric (pH meter) measurements. Each has distinct advantages and limitations depending on the system being titrated and the precision required.
| Feature | Indicator Method | pH Meter Method |
|---|---|---|
| Equipment | Buret, flask, indicator solution | Buret, flask, calibrated pH electrode |
| Precision | ± 0.5–1 pH unit (color transition range) | ± 0.01 pH unit |
| Weak/weak titrations | Unreliable—no sharp color break | Can locate inflection point on derivative plot |
| Polyprotic acids | Can detect first endpoint only if ΔpH is large | Can resolve multiple equivalence points |
| Data output | Single endpoint volume | Complete titration curve; pKₐ directly readable |
Comparison of end-point detection methods
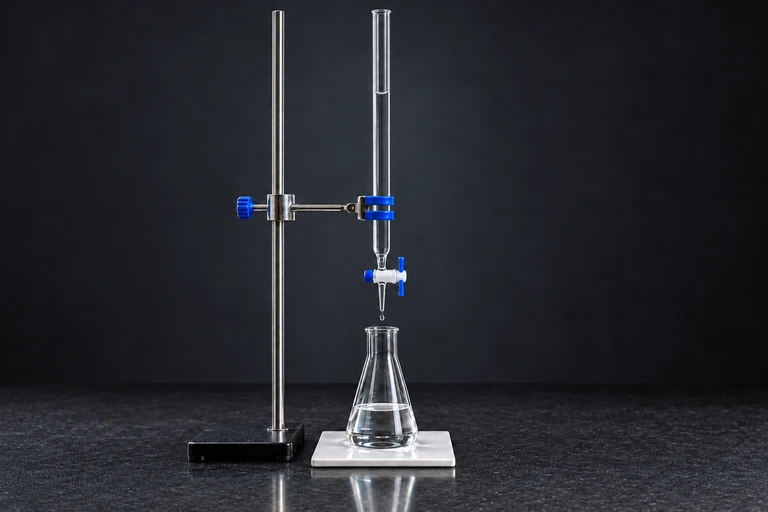 A buret delivers measured titrant into a flask containing the solution being analyzed.
SECTION 8
Connection to Advanced Theory
Acid-base titrations in the AP course rely on simplifying assumptions—dilute solutions, activity coefficients of unity, and negligible autoionization contributions. In more advanced analytical chemistry, these assumptions are relaxed, and the full alpha (α) fraction approach or exact proton-balance equations become necessary.
| Feature | AP-Level Treatment | Advanced / Analytical Treatment |
|---|---|---|
| Activity | Concentrations used directly as activities | Activity coefficients (γ) from Debye–Hückel; a = γ × C |
| Polyprotic acids | Treated as sequential monoprotic systems | Alpha fraction (α₀, α₁, α₂) derived from coupled equilibria |
| Exact pH calculation | ICE table or Henderson–Hasselbalch | Charge balance + mass balance solved simultaneously (proton balance) |
| Curve fitting | Qualitative sketch or point-by-point | Gran plot linearization to determine Kₐ and V(eq) precisely |
AP vs. advanced approaches to titration analysis
Understanding the AP-level framework thoroughly prepares you to step into these more rigorous models. The Henderson–Hasselbalch equation, for example, is a special case of the full alpha-fraction treatment, and the ICE-table approach is an approximation to the charge-balance method. If you continue into quantitative analysis or biochemistry, titration theory extends to amino acid zwitterion titrations, EDTA complexometric titrations, and redox titrations—all of which share the same underlying principle of stoichiometric equivalence.
SECTION 9
Practice Problems
Question 1: CONCEPTUAL
- A. pH = 7.00, because equal moles of acid and base have reacted
- B. pH > 7, because the conjugate base hydrolyzes in solution
- C. pH < 7, because the conjugate acid of the weak base hydrolyzes in solution
- D. pH < 7, because excess strong acid remains unreacted
Show answer (C)
Question 2: BASIC CALCULATION
- A. 12.0 mL
- B. 18.0 mL
- C. 20.0 mL
- D. 50.0 mL
Show answer (B)
Question 3: INTERMEDIATE
- A. 2.37
- B. 3.74
- C. 4.74
- D. 7.00
Show answer (B)
Question 4: APPLIED
Show answer
Question 5: CRITICAL THINKING