

SECTION 1
Historical Context & Motivation
In the late eighteenth century, Thomas Malthus warned that unchecked human population would grow exponentially, outstripping food supply and leading to catastrophe. His model, dP/dt = kP, predicted unbounded growth — a mathematical conclusion that troubled both economists and natural philosophers. While exponential models captured the early phase of population expansion, they failed spectacularly over longer time horizons because no real population grows without constraint. Resources deplete, disease spreads, and competition intensifies as a population nears the capacity of its environment.
The need for a more realistic model drove the Belgian mathematician Pierre-François Verhulst to introduce a self-limiting growth term in 1838. His logistic equation incorporated a carrying capacity — the maximum population an environment can sustain indefinitely. The logistic model predicts rapid initial growth that gradually decelerates as the population approaches this ceiling, producing the characteristic S-shaped (sigmoid) curve. This elegant modification resolved the paradox of infinite growth and became one of the most widely applied differential equations in biology, ecology, epidemiology, and even marketing.
1798 • Malthus Publishes Exponential Growth Model
1838 • Verhulst Proposes the Logistic Equation
1920 • Pearl & Reed Rediscover the Logistic Curve
1927 • Kermack–McKendrick Epidemic Model
Present • Logistic Models on the AP Calculus BC Exam
The central question the logistic model addresses is: How does a quantity grow when its rate of increase depends not only on its current size but also on how close it is to a maximum capacity? This question lies at the heart of many AP Calculus BC free-response and multiple-choice problems involving differential equations.
SECTION 2
Core Principles & Definitions
Before diving into the mathematics, it is essential to understand the conceptual building blocks that distinguish the logistic model from simpler growth models. The logistic differential equation rests on a few fundamental ideas, each of which carries specific mathematical meaning that you will encounter repeatedly on the AP exam.
Carrying Capacity (L)
Intrinsic Growth Rate (k)
Self-Limiting Factor (1 − P/L)
Inflection Point at P = L/2
Equilibrium Solutions
KEY TAKEAWAY
SECTION 3
Visual Explanation — The Logistic Curve
The signature shape of the logistic model is the S-curve (sigmoid curve). The diagram below plots a logistic solution P(t) against time, illustrating the three distinct phases of growth: the early exponential phase, the inflection transition, and the asymptotic approach to carrying capacity. Pay close attention to the location of the inflection point and the dashed carrying-capacity line — these features are tested heavily on the AP exam.
Notice how the concavity of the curve changes at the inflection point t*. For t < t*, the curve is concave up (the population is accelerating). For t > t*, the curve is concave down (the population is still growing but decelerating). This concavity change is directly tied to the second derivative d²P/dt², which the AP exam frequently asks you to analyze.
SECTION 4
Mathematical Framework
The mathematical heart of the logistic model is a first-order, separable, nonlinear differential equation. In this section we present the standard form of the equation, derive its general solution via partial fractions, and establish the key formulas you need for the AP exam.
THE LOGISTIC DIFFERENTIAL EQUATION
P = P(t) is the population at time t; k > 0 is the intrinsic growth rate; L > 0 is the carrying capacity. The product of the two factors kP and (1 − P/L) ensures growth is fastest at intermediate values and vanishes at P = 0 and P = L.
Solving by Separation of Variables
The logistic DE is separable. Rewriting dP/dt = kP(1 − P/L) and separating variables yields:
SEPARATION STEP
The left side is integrated using partial fraction decomposition: 1/[P(1 − P/L)] = 1/P + (1/L)/(1 − P/L). After integrating both sides and solving for P, we obtain the general solution.
GENERAL SOLUTION
P₀ = P(0) is the initial population. The constant A is determined by the initial condition. As t → ∞, e⁻ᵏᵗ → 0 so P(t) → L. When P₀ < L, A > 0 and the solution increases toward L. When P₀ > L, A < 0 and the solution decreases toward L.
MAXIMUM GROWTH RATE
Substituting P = L/2 into the DE: dP/dt = k(L/2)(1 − 1/2) = kL/4. This result is critical: the AP exam frequently asks for the population value at which the rate of change is greatest.
AP Exam Tip
SECTION 5
Slope Fields & Phase Line Analysis
On the AP exam you may be asked to sketch or interpret a slope field for the logistic DE or to perform a qualitative phase line analysis without solving the equation explicitly. Because the logistic DE is autonomous — the right-hand side depends only on P, not on t — the slope field has a special property: all line segments in a given horizontal strip (constant P) have the same slope. The phase line summarizes the behavior of dP/dt as a function of P alone, allowing you to determine stability of equilibria and the direction of change at a glance.
The left panel makes it clear why the maximum rate of change occurs at P = L/2: the graph of dP/dt versus P is a downward-opening parabola with roots at P = 0 and P = L, and the vertex of a parabola with roots at 0 and L lies at the midpoint P = L/2. This is a powerful shortcut — you never need to compute a second derivative to find the inflection point of the logistic solution. Simply recognize that the inflection occurs when the growth rate is maximized, i.e., at P = L/2.
Concavity from the Rate Curve
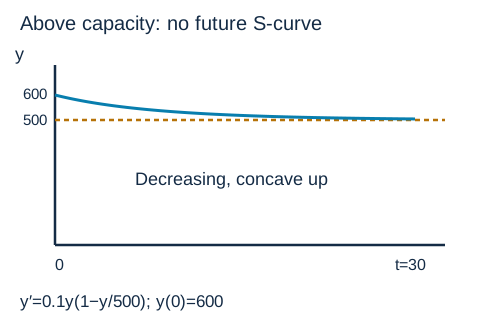 For y′ = 0.1 y(1 − y/500) with y(0) = 600, the initial rate is −12. The solution decreases toward 500 and is concave up for all future time; this trajectory has no future inflection point.Open full diagram
SECTION 6
Worked Example
Let us work through a complete AP-style problem. Suppose a fish population in a lake is modeled by the logistic differential equation:
GIVEN DIFFERENTIAL EQUATION
where P is measured in fish and t in years. The initial population is P(0) = 1000.
Full Logistic Model Analysis
- 1
Step 1 — Identify Parameters
Comparing dP/dt = 0.5P(1 − P/8000) with the standard form dP/dt = kP(1 − P/L), we identify k = 0.5 per year and L = 8000 fish. The initial condition is P₀ = 1000.k = 0.5, L = 8000, P₀ = 1000 - 2
Step 2 — Write the General Solution
The general solution is P(t) = L / (1 + Ae⁻ᵏᵗ). We compute A = (L − P₀)/P₀ = (8000 − 1000)/1000 = 7. Therefore:P(t) = 8000 / (1 + 7e⁻⁰·⁵ᵗ) - 3
Step 3 — Find the Population at t = 4 Years
Substitute t = 4: P(4) = 8000 / (1 + 7e⁻²). We compute e⁻² ≈ 0.1353, so 7e⁻² ≈ 0.9474. Then P(4) = 8000 / (1 + 0.9474) = 8000 / 1.9474 ≈ 4108 fish.P(4) ≈ 4108 fish - 4
Step 4 — Determine When Growth Rate Is Maximum
The growth rate dP/dt is maximized when P = L/2 = 4000. We solve 4000 = 8000/(1 + 7e⁻⁰·⁵ᵗ), giving 1 + 7e⁻⁰·⁵ᵗ = 2, so 7e⁻⁰·⁵ᵗ = 1, hence e⁻⁰·⁵ᵗ = 1/7. Taking the natural log: −0.5t = ln(1/7) = −ln 7, so t = 2 ln 7 ≈ 2(1.9459) ≈ 3.892 years.Maximum growth rate occurs at t ≈ 3.892 years when P = 4000 - 5
Step 5 — Compute the Maximum Growth Rate
The maximum value of dP/dt equals kL/4 = (0.5)(8000)/4 = 1000 fish per year. Alternatively, substitute P = 4000 into the DE: dP/dt = 0.5(4000)(1 − 4000/8000) = 0.5(4000)(0.5) = 1000.(dP/dt)_max = 1000 fish/year - 6
Step 6 — Long-Term Behavior
As t → ∞, e⁻⁰·⁵ᵗ → 0, so P(t) → 8000/(1 + 0) = 8000. The population approaches the carrying capacity of 8000 fish but never exceeds it, confirming L = 8000 is a stable equilibrium.lim(t→∞) P(t) = 8000 fish = L
 For P′ = 0.5P(1 − P/8,000) with P(0) = 1,000, the population approaches 8,000 fish. Growth is fastest at 4,000 fish, about 3.89 years after the start.
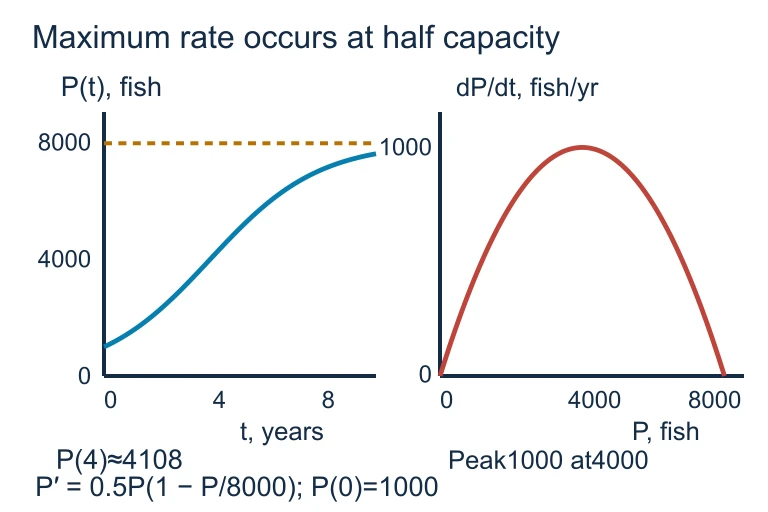 For P′ = 0.5P(1 − P/8,000) with P(0) = 1,000, the population approaches 8,000 fish. Growth is fastest at 4,000 fish, about 3.89 years after the start.
SECTION 7
Comparing Exponential & Logistic Models
Understanding when and why to choose a logistic model over an exponential model is a critical skill on the AP exam. The table below contrasts the two models across all the features that commonly appear in exam questions.
| Feature | Exponential Model | Logistic Model |
|---|---|---|
| Differential Equation | dP/dt = kP | dP/dt = kP(1 − P/L) |
| Solution | P(t) = P₀eᵏᵗ | P(t) = L / (1 + Ae⁻ᵏᵗ) |
| Long-Term Behavior | P → ∞ (unbounded growth) | P → L (bounded by carrying capacity) |
| Concavity | Always concave up (k > 0) | Concave up for P < L/2; concave down for P > L/2 |
| Inflection Point | Does not exist | At P = L/2 |
| Equilibria | P = 0 only (unstable) | P = 0 (unstable) and P = L (stable) |
| When to Use | Short-term, unlimited resources | Long-term, limited resources / saturation |
Exponential vs. Logistic Growth Model Comparison
KEY TAKEAWAY
SECTION 8
Connection to Advanced Theory
The logistic differential equation is the gateway to a rich family of models studied in higher mathematics and applied science. While the AP Calculus BC exam focuses exclusively on the autonomous logistic DE and its closed-form solution, understanding where the model sits in the broader landscape helps you appreciate its elegance and its limitations.
| AP Calculus BC (Logistic) | Advanced Extension |
|---|---|
| Single population: dP/dt = kP(1 − P/L) | Lotka–Volterra (predator–prey): system of coupled DEs for interacting species |
| Constant carrying capacity L | Time-varying capacity L(t) to model seasonal or changing environments |
| Deterministic closed-form solution | Stochastic logistic models with random noise (SDEs) |
| Continuous growth | Discrete logistic map: xₙ₊₁ = rxₙ(1 − xₙ), which can exhibit chaos |
| Separation of variables (exact solution) | Euler's method and Runge–Kutta for numerical approximation of non-separable DEs |
AP Logistic Model vs. Advanced Extensions
One particularly striking extension is the discrete logistic map, xn+1 = rxn(1 − xn), which Robert May studied in 1976. For small values of the parameter r, the discrete version converges to a stable equilibrium just like the continuous case. However, as r increases, the system undergoes period-doubling bifurcations and eventually exhibits deterministic chaos — an entirely unpredictable behavior arising from a deceptively simple equation. This connection between the smooth, predictable continuous logistic model and the chaotic discrete version illustrates the depth hidden in what initially appears to be a straightforward differential equation.
Looking Ahead
SECTION 9
Practice Problems
Question 1: CONCEPTUAL
- A. P(t) is increasing and concave up for all t > 0.
- B. P(t) is increasing and concave down for all t > 0.
- C. P(t) is decreasing and concave up for all t > 0.
- D. P(t) is increasing with an inflection point at P = 2500.
- E. P(t) approaches 0 as t → ∞.
Show answer (B)
Question 2: BASIC CALCULATION
- A. 200
- B. 1000
- C. 2000
- D. ∞
- E. 500
Show answer (C)
Question 3: INTERMEDIATE
- A. Max rate = 180 people/day; N(t) = 600/(1 + 59e⁻¹·²ᵗ)
- B. Max rate = 300 people/day; N(t) = 600/(1 + 59e⁻⁰·⁰⁰²ᵗ)
- C. Max rate = 180 people/day; N(t) = 600/(1 + 590e⁻¹·²ᵗ)
- D. Max rate = 90 people/day; N(t) = 600/(1 + 59e⁻⁰·⁶ᵗ)
- E. Max rate = 180 people/day; N(t) = 300/(1 + 29e⁻¹·²ᵗ)
Show answer (A)
Question 4: APPLIED
5 ptsShow answer
Question 5: CRITICAL THINKING
4 ptsShow answer
SUMMARY
Lesson Summary
Summary
The logistic differential equation dP/dt = kP(1 − P/L) models growth that is self-limiting due to a finite carrying capacity L. Its general solution, P(t) = L/(1 + Ae⁻ᵏᵗ) where A = (L − P₀)/P₀, produces the signature S-shaped sigmoid curve. The solution has two equilibrium solutions: P = 0 (unstable) and P = L (stable). A central result is that the maximum growth rate is kL/4 and occurs at the inflection point P = L/2, where the solution transitions from concave up to concave down.
For the AP exam, remember these essential skills: (1) identify k and L from any algebraic form of the DE, (2) write the explicit solution using the initial condition, (3) compute the long-term limit (always L for 0 < P₀ < ∞), (4) find the inflection point and maximum rate, and (5) interpret results in context with proper units. The logistic model stands in contrast to unbounded exponential growth, and its qualitative features — slope fields, phase lines, and concavity analysis — are among the most frequently tested topics on the differential equations portion of the AP Calculus BC exam.