
SECTION 1
Historical Context & Motivation
The idea that a quantity can be understood as the running total of its rate of change is one of the deepest insights in the history of mathematics. Long before formal integration existed, ancient Greek mathematicians such as Archimedes computed areas under parabolas by exhaustion—summing ever-finer slices and observing that a single number emerged in the limit. Centuries later, Newton and Leibniz independently recognized that the process of accumulating area under a curve could itself be viewed as a function—one whose derivative recovers the original curve. This reciprocal relationship, codified in the Fundamental Theorem of Calculus, transforms every continuous function f into a new accumulation function F(x) = ∫ from a to x of f(t) dt, whose behavior—where it increases, decreases, or changes concavity—is completely governed by the integrand f.
~250 BCE • Archimedes and Exhaustion
1668 • Barrow's Geometric Lectures
1687 • Newton's Principia
1823 • Cauchy's Rigorous Integral
The central question this lesson addresses is: given a graph or formula for f, how can we deduce the behavior of F(x) = ∫ from a to x of f(t) dt without ever computing the antiderivative explicitly? On the AP Calculus BC exam, you will regularly encounter graphs of f and be asked to determine where F is increasing or decreasing, locate its relative extrema, identify intervals of concavity, and find inflection points—all by reading the sign and behavior of f directly.
SECTION 2
Core Principles & Definitions
An accumulation function is defined as F(x) = ∫ from a to x of f(t) dt, where a is a fixed lower limit and x is the variable upper limit. The Fundamental Theorem of Calculus, Part 1 tells us that F′(x) = f(x) whenever f is continuous, which means the integrand itself acts as the derivative of the accumulation function. This single fact unlocks a cascade of interpretive tools: the first-derivative test applies to f to characterize F, and f′ (the derivative of the integrand) serves as F″, governing the concavity of F.
Accumulation Function
FTC Part 1: F′(x) = f(x)
Increasing / Decreasing
Concavity via f′
Initial Value F(a) = 0
KEY TAKEAWAY
SECTION 3
Visual Explanation — From f to F
The diagram below shows a continuous function f on the interval [0, 8] and the corresponding accumulation function F(x) = ∫ from 0 to x of f(t) dt. Study how the sign and shape of f translate directly into the behavior of F. Regions where f is positive correspond to intervals where F is increasing, while regions where f is negative correspond to intervals where F is decreasing. Where f crosses zero with a sign change, F attains a relative extremum. Where f has a local maximum or minimum (meaning f′ changes sign), F has an inflection point.
In the top panel, observe that f is positive on (0, 2) and (4, 6) and negative on (2, 4) and (6, 8). In the bottom panel, F rises on those first intervals and falls on the latter ones—exactly matching the sign of f. The relative maximum of F at x = 2 occurs because f transitions from positive to negative there; the relative minimum of F at x = 4 corresponds to f changing from negative to positive. The inflection points of F, marked by the orange dashed lines, align with the locations where f achieves a local extremum—because at those t-values, f′ changes sign, meaning F″ changes sign.
SECTION 4
Mathematical Framework
The theoretical backbone of accumulation function analysis rests on two pillars: the Fundamental Theorem of Calculus (Part 1) and the standard derivative tests applied through the lens of that theorem. Below are the key equations and the logic that connects them.
ACCUMULATION FUNCTION DEFINITION
Here a is a fixed constant, x is the variable upper limit, and f is assumed continuous on an interval containing a. The dummy variable t distinguishes the integration variable from the limit.
FTC PART 1 — FIRST DERIVATIVE
The derivative of F at x equals the integrand evaluated at x. Consequently, F is increasing where f(x) > 0 and decreasing where f(x) < 0. Zeros of f where f changes sign are critical points of F and yield relative extrema by the first-derivative test.
SECOND DERIVATIVE — CONCAVITY
Because F′ = f, differentiating again gives F″ = f′. Therefore F is concave up where f is increasing and concave down where f is decreasing. Points where f has a local maximum or minimum correspond to inflection points of F (provided f′ actually changes sign).
CHAIN RULE EXTENSION
When the upper limit is a composite function g(x) rather than simply x, the chain rule introduces the factor g′(x). On AP Calculus BC, this extension appears frequently and requires careful attention to the inner derivative.
Exam Tip
 Suppose a tank receives and releases 4 gal/min for 5 minutes. Its 200 gal inventory stays constant while 20 gal enters and 20 gal leaves: net change is zero and total throughput is 40 gal.
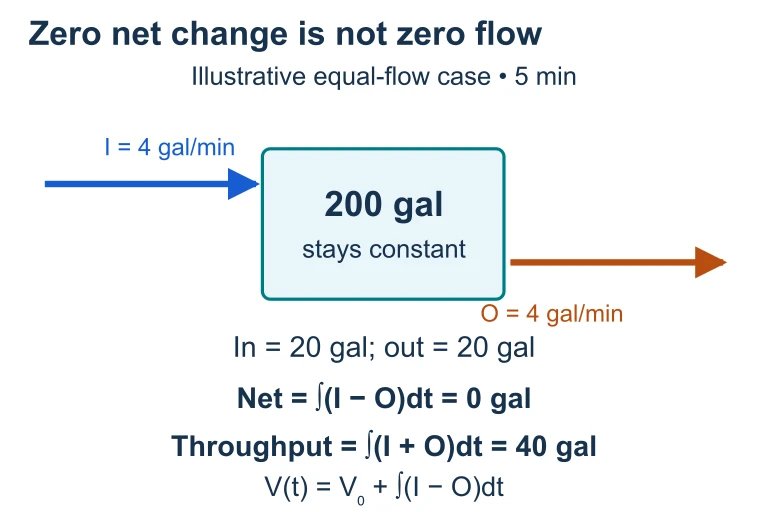 Suppose a tank receives and releases 4 gal/min for 5 minutes. Its 200 gal inventory stays constant while 20 gal enters and 20 gal leaves: net change is zero and total throughput is 40 gal.
SECTION 5
Detailed Sign-Chart Breakdown
To systematically interpret an accumulation function, construct a multi-row sign chart that tracks f, f′, and their implications for F. The following table and diagram illustrate how each row of the chart maps onto the behavior of F. This technique is especially valuable on the AP free-response section, where organizing information clearly earns communication points.
| Condition on f or f′ | Implication for F | Graphical Signature |
|---|---|---|
| f(x) > 0 | F is increasing (F′ > 0) | F graph rises from left to right |
| f(x) < 0 | F is decreasing (F′ < 0) | F graph falls from left to right |
| f(x) = 0 with sign change + → − | F has a relative maximum | F reaches a peak |
| f(x) = 0 with sign change − → + | F has a relative minimum | F reaches a valley |
| f′(x) > 0 (f increasing) | F is concave up (F″ > 0) | F curves upward (bowl shape) |
| f′(x) < 0 (f decreasing) | F is concave down (F″ < 0) | F curves downward (cap shape) |
| f has a local extremum | F has an inflection point | F changes concavity direction |
Complete mapping from the integrand f and its derivative f′ to the behavior of the accumulation function F.
The sign chart is a powerful organizational tool on exam day. Begin by listing the zeros of f where it changes sign—these are the critical numbers of F. Then determine the sign of f on each sub-interval to fill in F's monotonic behavior. Next, identify where f itself has local extrema (i.e., where f′ changes sign) to locate F's inflection points. Finally, use f's monotonicity on each sub-interval to determine F's concavity. This systematic approach prevents sign errors and ensures you capture every feature the question asks about.
SECTION 6
Worked Example
Consider the function f defined on [0, 6] whose graph consists of line segments connecting the points (0, 4), (2, 0), (4, −2), and (6, 0). Let F(x) = ∫ from 0 to x of f(t) dt. We will determine where F is increasing and decreasing, locate its relative extrema, find its inflection points, and compute F(6).
Full Analysis of F from a Piecewise-Linear f
- 1
Step 1 — Identify the formula for f on each segment
On [0, 2], f decreases linearly from 4 to 0, so f(t) = 4 − 2t. On [2, 4], f decreases linearly from 0 to −2, so f(t) = −t + 2. On [4, 6], f increases linearly from −2 to 0, so f(t) = t − 6.f(t) is piecewise linear: {4 − 2t on [0,2]; −t + 2 on [2,4]; t − 6 on [4,6]} - 2
Step 2 — Determine where F is increasing and decreasing
Since F′(x) = f(x), we need the sign of f. On (0, 2), f(t) = 4 − 2t > 0 for t < 2, so F is increasing. On (2, 6), f(t) < 0 (the graph is below the t-axis), so F is decreasing on the entire interval (2, 6).F increasing on (0, 2); F decreasing on (2, 6) - 3
Step 3 — Identify relative extrema of F
The only zero of f with a sign change is at x = 2, where f transitions from positive to negative. By the first-derivative test, F has a relative (and absolute) maximum at x = 2. Although f(6) = 0, f does not change sign there on the given domain, so x = 6 is not a relative extremum in the interior.F has a relative maximum at x = 2 - 4
Step 4 — Determine concavity and inflection points
F″(x) = f′(x). On (0, 2), f′ = −2 < 0, so F is concave down. On (2, 4), f′ = −1 < 0, so F is still concave down. On (4, 6), f′ = 1 > 0, so F is concave up. Because F″ = f′ changes sign from negative to positive at x = 4, there is an inflection point at x = 4. Note: at x = 2, f has a corner (f′ changes from −2 to −1) but f′ does not change sign—it remains negative—so there is no inflection point there.F concave down on (0, 4), concave up on (4, 6); inflection point at x = 4 - 5
Step 5 — Compute F(6) using geometric area
F(6) = ∫₀⁶ f(t) dt, which we compute as the sum of signed areas. On [0, 2]: the triangle has base 2 and height 4, so area = ½ × 2 × 4 = 4 (positive). On [2, 4]: the triangle has base 2 and height 2 (below axis), so signed area = −½ × 2 × 2 = −2. On [4, 6]: the triangle has base 2 and height 2 (below axis), so signed area = −½ × 2 × 2 = −2. Therefore F(6) = 4 − 2 − 2 = 0.F(6) = 0
Why This Matters on the AP Exam
SECTION 7
Common Pitfalls & Strategies
| Common Mistake | Why It's Wrong | Correct Approach |
|---|---|---|
| Confusing the graph of f with the graph of F | The given graph is the derivative of F, not F itself. Reading it as F leads to wrong extrema and concavity conclusions. | Always remind yourself: the graph you see is F′. Zeros of this graph are critical points of F. |
| Saying F = 0 wherever f = 0 | f(x) = 0 means F′(x) = 0, not F(x) = 0. The value of F at that point depends on the accumulated area up to x. | Compute F at specific points by adding signed areas from the starting point a. |
| Forgetting the chain rule when the upper limit is g(x) | d/dx [∫ₐ^{g(x)} f(t) dt] = f(g(x)) · g′(x), not just f(g(x)). Omitting g′(x) is a common chain-rule error. | Always check whether the upper limit is a composite function; if so, multiply by the inner derivative. |
| Claiming inflection point where f has a zero | Inflection points of F occur where F″ = f′ changes sign, i.e., where f has a local extremum—not where f is zero. | For inflection points of F, look at where f changes from increasing to decreasing or vice versa. |
| Ignoring signed area (treating all area as positive) | The definite integral produces net signed area. Regions below the axis contribute negative values to F. | Carefully track which portions of the graph lie above and below the axis, and assign the correct sign. |
Five frequent errors on accumulation function problems and how to avoid them.
KEY TAKEAWAY
SECTION 8
Connections to Advanced Topics
The accumulation function concept extends naturally to several advanced topics that appear on the AP Calculus BC exam and in subsequent mathematics courses. Understanding these connections deepens your mastery and prepares you for problems that combine accumulation with other integration techniques.
| Standard Accumulation | Advanced Extension |
|---|---|
| F(x) = ∫ₐˣ f(t) dt with constant lower limit | G(x) = ∫_{h(x)}^{g(x)} f(t) dt with variable limits on both ends; differentiate using G′(x) = f(g(x))·g′(x) − f(h(x))·h′(x) |
| Interpreting net signed area geometrically | Area between curves: ∫ₐᵇ |f(t) − g(t)| dt requires careful sign analysis and often splits into sub-intervals |
| Accumulation of a rate to find a quantity | Differential equations: dy/dx = f(x) with y(a) = y₀ yields y(x) = y₀ + ∫ₐˣ f(t) dt, connecting initial-value problems directly to accumulation |
| F(x) for continuous f with closed-form area | Accumulation functions defined by integrals with no elementary antiderivative (e.g., erf(x) = (2/√π) ∫₀ˣ dt), where FTC still governs behavior despite the lack of a formula for F |
| Single-variable accumulation | In multivariable calculus, line integrals accumulate a function along a curve, and the Fundamental Theorem for Line Integrals is the direct generalization of FTC Part 1 |
How standard accumulation function analysis connects to more advanced calculus topics.
On the AP Calculus BC exam specifically, accumulation function problems frequently appear alongside particle motion (where position is the integral of velocity), rate-in/rate-out contexts (where total quantity is the integral of a net rate), and improper integrals (where accumulation extends to infinite limits). In each context, the interpretive framework remains the same: the sign of the integrand controls monotonicity, and the behavior of the integrand controls concavity. Mastering this single concept equips you to handle a remarkably wide array of exam questions.
SECTION 9
Practice Problems
Question 1: CONCEPTUAL
- A. F is increasing on (1, 7) because f is defined everywhere on this interval.
- B. F has a relative minimum at x = 5 because f(5) = 0.
- C. F has a relative maximum at x = 5 and is concave down on (1, 5).
- D. F has an inflection point at x = 5 because f changes sign there.
- E. F is concave up on (1, 5) because f is positive there.
Show answer (C)
Question 2: BASIC CALCULATION
- A. −9
- B. 0
- C. 9
- D. 18
- E. 27
Show answer (B)
Question 3: INTERMEDIATE
- A. sin(x²)
- B. 2x · sin(x²)
- C. −cos(x²) + 1
- D. 2x · cos(x²)
- E. sin(2x)
Show answer (B)
Question 4: APPLIED
5 ptsShow answer
Question 5: CRITICAL THINKING
3 ptsShow answer
SUMMARY
Lesson Summary
Summary
An accumulation function F(x) = ∫ₐˣ f(t) dt represents the net signed area under the curve f from a to x. By the Fundamental Theorem of Calculus (Part 1), F′(x) = f(x), so the sign of f directly determines where F is increasing or decreasing. Zeros of f where a sign change occurs produce relative extrema of F. Since F″(x) = f′(x), the concavity of F depends on whether f is increasing (concave up) or decreasing (concave down), and inflection points of F occur where f has local extrema.
When the upper limit is a composite function g(x), remember the chain rule extension: d/dx [∫ₐ^{g(x)} f(t) dt] = f(g(x)) · g′(x). For the exam, always build a sign chart tracking f and f′ to systematically extract the full behavior of F, and cite the FTC explicitly in your justifications to earn full rubric credit.