Accumulation Functions
and Area
Learn how to interpret the behavior of accumulation functions defined as integrals, connecting signed area to increasing, decreasing, and extreme values.
What Is an Accumulation Function?
An accumulation function is a function defined by a definite integral with a variable upper limit. It "accumulates" the signed area under a curve \( f(t) \) from a fixed starting point \( a \) up to a variable endpoint \( x \).
The value \( F(x) \) represents the net signed area between the graph of \( f \) and the \( t \)-axis from \( t = a \) to \( t = x \). Area above the axis counts as positive, area below as negative.
Visualizing Signed Area
Why Does This Matter?
The Fundamental Theorem (Part 1)
This theorem is the bridge: to understand how \( F \) behaves (increasing, decreasing, concavity), we study \( f \) and \( f' \) directly.
Connecting \( f \) to \( F \)
Follow the salt through a working mixing rig
 For net flow R(t) = 4t − t² gal/min and 10 gal initially, V(t) = 10 + 2t² − t³/3. Volume peaks at t = 4 minutes, when the net rate changes from positive to negative.
Signed net flow and inventory
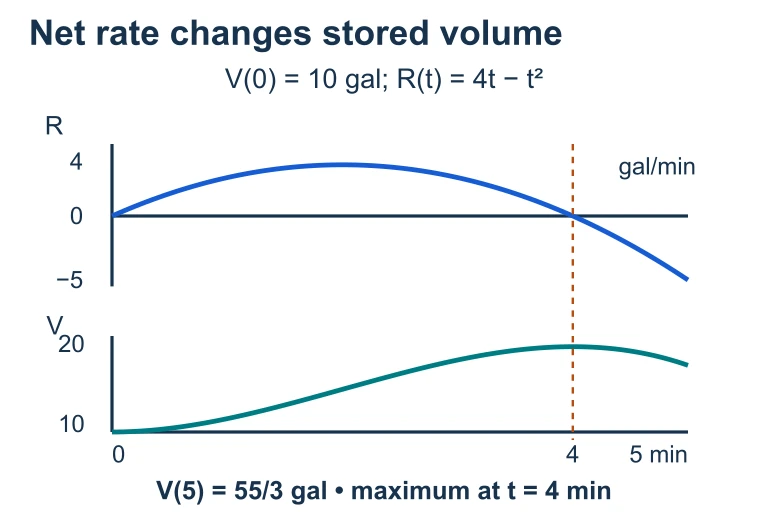 For net flow R(t) = 4t − t² gal/min and 10 gal initially, V(t) = 10 + 2t² − t³/3. Volume peaks at t = 4 minutes, when the net rate changes from positive to negative.
Key Distinction: \( f \) vs \( F \)
| Property | \( f(x) \) (the integrand) | \( F(x) \) (accumulation) |
|---|---|---|
| Role | Rate of change of \( F \) | Net signed area from \( a \) to \( x \) |
| Sign of \( f \) | Above/below axis | Increasing/decreasing |
| Zero of \( f \) | Crosses the \( t \)-axis | Possible extremum of \( F \) |
| Sign of \( f' \) | \( f \) increasing/decreasing | Concavity of \( F \) |
| Zero of \( f' \) | Extremum of \( f \) | Inflection point of \( F \) |
Concavity of \( F \)
Since \( F'(x) = f(x) \), it follows that \( F''(x) = f'(x) \). So the concavity of the accumulation function depends on whether the integrand is increasing or decreasing.
How to Analyze \( F(x) \)
Example 1: Reading the Graph
Let \( F(x) = \displaystyle\int_0^x f(t)\,dt \), where \( f \) is shown below. Find where \( F \) is increasing, decreasing, and has extrema.
Example 2: Evaluating \( F \) Numerically
Using the same graph of \( f \) from Example 1, suppose the area of the region above the axis on \( [0,4] \) is 10 and the area below the axis on \( [4,6] \) is 3. Find \( F(4) \) and \( F(6) \).
Example 3: Concavity and Inflection
The Starting Value: \( F(a) = 0 \)
A common source of confusion: the accumulation function always has the value zero at the lower limit of integration, regardless of what \( f(a) \) equals.
Absolute Extrema of \( F \)
To find the absolute maximum or minimum of \( F \) on a closed interval, compare the values of \( F \) at:
Common Mistakes
Summary Table
| If you observe... | On \( f \) | Then \( F \)... |
|---|---|---|
| Positive values | \( f(x) > 0 \) | is increasing |
| Negative values | \( f(x) < 0 \) | is decreasing |
| Zero crossing (+ to -) | \( f \) changes from + to - | has a local maximum |
| Zero crossing (- to +) | \( f \) changes from - to + | has a local minimum |
| Increasing | \( f' > 0 \) | is concave up |
| Decreasing | \( f' < 0 \) | is concave down |
| Local extremum | \( f' = 0 \), sign change | has an inflection point |
Question 1 of 5
Let \( F(x) = \displaystyle\int_0^x f(t)\,dt \). If \( f(3) = 0 \) and \( f \) changes from positive to negative at \( t = 3 \), what happens to \( F \) at \( x = 3 \)?
Question 2 of 5
If \( f \) is positive and increasing on \( (1, 5) \), what can you say about \( F(x) = \displaystyle\int_1^x f(t)\,dt \) on that interval?
Question 3 of 5
Given \( F(x) = \displaystyle\int_2^x f(t)\,dt \), what is the value of \( F(2) \)?
Question 4 of 5
The graph of \( f \) has a local maximum at \( t = 4 \). What does \( F(x) = \displaystyle\int_0^x f(t)\,dt \) have at \( x = 4 \)?
Question 5 of 5
Let \( F(x) = \displaystyle\int_0^x f(t)\,dt \). On \( [0,3] \) the area above the axis is 8, and on \( [3,7] \) the area below the axis is 5. What is \( F(7) \)?