
SECTION 1
Historical Context & Motivation
The relationship between a function and its rate of change has been a central concern of mathematics since the invention of calculus in the late seventeenth century. Before analytic formulas were commonplace, mathematicians relied on geometric reasoning — drawing tangent lines, measuring slopes, and inferring curvature — to understand how quantities evolve. The ability to move fluently between a function's graph and the graph of its derivative is not merely a classroom exercise; it is the conceptual backbone that connects algebraic differentiation rules to real-world interpretation of motion, optimization, and modeling.
1684 • Leibniz Publishes His Calculus
1748 • Euler's Introductio
1823 • Cauchy Formalizes Limits
1960s • Graphing in Calculus Education
The central question this lesson addresses is both elegant and practical: given only the graph of a function, how can you deduce the graph of its derivative — and conversely, given the graph of a derivative, what can you infer about the original function's shape? Mastering this bidirectional reasoning is essential for the AP Calculus AB exam, where many free-response and multiple-choice questions present graphical information rather than explicit formulas.
SECTION 2
Core Principles & Definitions
The interplay between a function f and its derivative f′ rests on a small set of foundational ideas. Each principle converts a visual feature on one graph into a corresponding feature on the other, creating a precise translation dictionary between shape and sign.
Slope ↔ Value
Increasing / Decreasing
Extrema ↔ Zeros
Concavity ↔ Slope of f′
Corners & Cusps
SECTION 3
Visual Explanation: From f to f′
The diagram below shows a function f (top) and its derivative f′ (bottom) aligned on the same x-axis. Study how features on the top graph translate to features on the bottom graph: where f has a local maximum, f′ crosses zero from positive to negative; where f has an inflection point, f′ has a local extremum.
Notice the shaded regions on the f′ graph. The green-tinted region where f′ > 0 corresponds to the interval on which f is climbing. The red-tinted region where f′ < 0 corresponds to the interval on which f is falling. This visual pairing is the single most important skill for the graphical reasoning questions on the AP exam.
 For f(x) = x³ − 3x, height, slope, and change in slope are different quantities. The extrema occur at x = −1 and 1; concavity changes at x = 0.
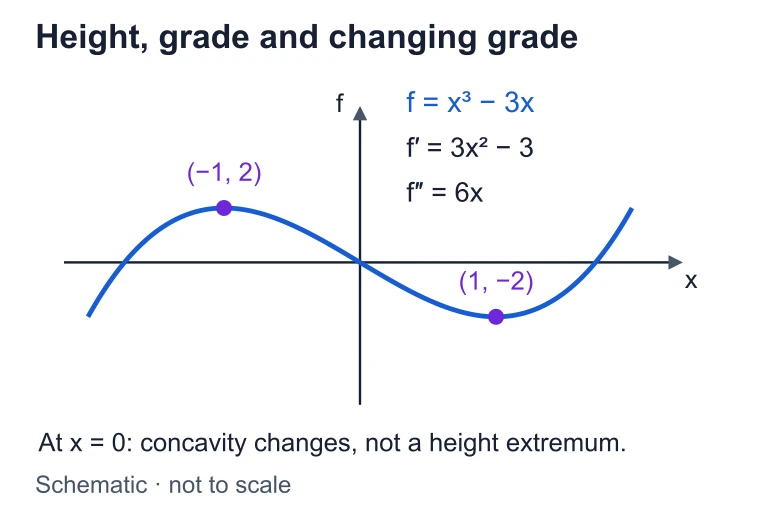 For f(x) = x³ − 3x, height, slope, and change in slope are different quantities. The extrema occur at x = −1 and 1; concavity changes at x = 0.
SECTION 4
Mathematical Framework
The formal connections between f and f′ are encoded in the first derivative test and the second derivative test. These tests provide systematic criteria for classifying critical points and determining the overall shape of a graph without plotting hundreds of points.
FIRST DERIVATIVE TEST
c is a critical number; the sign change of f′ determines whether f peaks or dips.
SECOND DERIVATIVE TEST
f″(c) measures concavity at the critical point. Negative concavity (concave down) implies a peak; positive concavity (concave up) implies a valley.
CONCAVITY AND INFLECTION
The equivalence among these three statements is the bridge connecting the f, f′, and f″ graphs.
When sketching f′ from f, estimate the slope of the tangent line at several representative x-values, plot those slope values, and connect them smoothly. When reconstructing f from f′, integrate qualitatively: note where f′ is positive (f rises), negative (f falls), zero (f has a horizontal tangent), increasing (f is concave up), and decreasing (f is concave down). These two procedures are inverses of one another and together form the complete graphical toolkit.
SECTION 5
Sign Charts & Feature Mapping
A sign chart is a compact summary tool that organizes the sign of f′ (and f″) across intervals, making it straightforward to determine the behavior of f. The table below codifies every possible combination of f′ and f″ signs and the resulting graph behavior.
| f′ sign | f″ sign | f behavior | Graph shape |
|---|---|---|---|
| + (positive) | + (positive) | Increasing, concave up | Rising and bending upward ⌣ |
| + (positive) | − (negative) | Increasing, concave down | Rising and bending downward ⌢ |
| − (negative) | + (positive) | Decreasing, concave up | Falling and bending upward ⌣ |
| − (negative) | − (negative) | Decreasing, concave down | Falling and bending downward ⌢ |
All four combinations of f′ and f″ signs determine the shape of the graph of f.
SECTION 6
Worked Example: Sketching f′ from f
Let f(x) = x³ − 3x. We will sketch the graph of f, derive f′ analytically, and verify the graphical correspondence.
Worked example
- 1
Step 1 — Find f′(x)
Differentiate: f′(x) = 3x² − 3 = 3(x² − 1) = 3(x − 1)(x + 1).f′(x) = 3(x − 1)(x + 1) - 2
Step 2 — Find critical points
Set f′(x) = 0: 3(x − 1)(x + 1) = 0 gives x = −1 and x = 1. Evaluate f at these: f(−1) = (−1)³ − 3(−1) = 2 and f(1) = 1 − 3 = −2.Critical points: (−1, 2) and (1, −2) - 3
Step 3 — First derivative sign chart
Test intervals: for x < −1, pick x = −2, f′(−2) = 3(4 − 1) = 9 > 0. For −1 < x < 1, pick x = 0, f′(0) = −3 < 0. For x > 1, pick x = 2, f′(2) = 3(4 − 1) = 9 > 0. So f increases on (−∞, −1), decreases on (−1, 1), and increases on (1, ∞).Local max at x = −1, local min at x = 1 - 4
Step 4 — Concavity via f″
f″(x) = 6x. Set f″ = 0: x = 0. For x < 0, f″ < 0 (concave down); for x > 0, f″ > 0 (concave up). Thus x = 0 is an inflection point of f and corresponds to the minimum of f′.Inflection point at (0, 0); f′ has minimum at x = 0 - 5
Step 5 — Sketch verification
The graph of f′(x) = 3x² − 3 is an upward-opening parabola with vertex at (0, −3) and x-intercepts at x = ±1. This matches our analysis: f′ > 0 outside [−1, 1], f′ < 0 inside (−1, 1), and f′ has its minimum at x = 0 — exactly the inflection point of f.✓ The f′ parabola confirms all features of f.
SECTION 7
Common Pitfalls & Clarifications
| Common Mistake | Why It's Wrong | Correct Reasoning |
|---|---|---|
| f′ = 0 always means an extremum | f′ must change sign to produce an extremum; f(x) = x³ has f′(0) = 0 but no max or min | Check sign change of f′ across the critical point |
| Confusing the y-value of f with the y-value of f′ | A high point on f does not imply a high point on f′; the height of f′ reflects the slope, not the position | Read the f′ graph as slopes of f, not as positions of f |
| Assuming f′ has the same shape as f | Differentiation changes the degree and type of function; a cubic becomes a quadratic | Sketch f′ by estimating slopes at many points on f |
| Ignoring non-differentiable points | Corners, cusps, and vertical tangents on f create discontinuities on f′ that must be shown | Mark open circles or jumps on f′ at non-differentiable x-values |
Frequent errors on AP exam graph-sketching questions
SECTION 8
Connections to Advanced Topics
The graph-sketching techniques in this lesson form the gateway to several deeper topics encountered in AP Calculus BC and beyond. Understanding how derivative graphs encode information about a function prepares you for the rigorous study of antiderivatives, accumulation functions, and differential equations.
| AP Calculus AB Skill | Advanced Extension |
|---|---|
| Sketching f′ from f | Sketching f″ from f′ — extending the chain to higher-order derivatives (BC topic) |
| Reading f from f′ graph | Accumulation functions: F(x) = ∫₀ˣ f′(t) dt and the Fundamental Theorem of Calculus |
| Sign chart for f′ and f″ | Phase-plane analysis in differential equations (university-level) |
| Identifying inflection points | Taylor polynomial error bounds depend on higher-derivative behavior (BC topic) |
How AB curve-sketching skills extend into BC and university-level mathematics
In particular, the transition from "reading the derivative graph" to "computing definite integrals as signed areas under f′" is the conceptual leap that connects Unit 5 (Analytical Applications) to Unit 6 (Integration and Accumulation of Change) in the AP Calculus AB curriculum. If you can fluently move from f to f′ and back, the Fundamental Theorem of Calculus will feel like a natural formalization of what you already understand graphically.
SECTION 9
Practice Problems
Question 1: CONCEPTUAL
- A. f is increasing and concave up
- B. f is increasing and concave down
- C. f is decreasing and concave up
- D. f is decreasing and concave down
- E. f is increasing and linear
Show answer (B)
Question 2: BASIC CALCULATION
- A. 0
- B. 1
- C. 2
- D. 3
- E. 4
Show answer (C)
Question 3: INTERMEDIATE
- A. f is constant on (−∞, 1), then decreasing on (1, 5), then constant on (5, ∞)
- B. f is constant on (−∞, 1), then increasing on (1, 5), then constant on (5, ∞)
- C. f is increasing on (−∞, 1), then constant on (1, 5), then increasing on (5, ∞)
- D. f is increasing everywhere
- E. f has a local maximum at x = 3
Show answer (B)
Question 4: APPLIED
Show answer
Question 5: CRITICAL THINKING