

SECTION 1
Historical Context & Motivation
The idea of a limit—what value a quantity approaches as an input draws closer and closer to some target—lies at the very heart of calculus. Long before epsilon-delta proofs were formalized, mathematicians relied on numerical experimentation: computing outputs for inputs that crept ever nearer to a point of interest, then observing whether those outputs converged. This intuitive, table-driven approach to limits preceded the rigorous framework by more than a century, and it remains one of the most powerful tools for building intuition about how functions behave near points of discontinuity, indeterminate forms, or asymptotic boundaries.
1670s • Newton's Fluxions
1684 • Leibniz Publishes Calculus
1821 • Cauchy's Cours d'Analyse
1861 • Weierstrass's ε-δ Definition
Despite the power of the formal definition, the central question that table-based estimation addresses is fundamentally practical: When we cannot simply plug in a value—because the function is undefined, indeterminate, or otherwise mysterious at that point—how can we use nearby data to predict the value the function is heading toward? This section of the course equips you with a systematic, numerical lens for answering that question.
SECTION 2
Core Principles & Definitions
Before diving into tables of values, it is essential to internalize several foundational ideas. The informal definition of a limit states that lim as x → c of f(x) = L means the values f(x) can be made as close to L as we wish by choosing x sufficiently close to c (but not equal to c). Notice that the function need not be defined at x = c itself; what matters is the trend of outputs as inputs converge on c from both sides. When we build a table, we are sampling that trend numerically.
Left-Hand Limit
Right-Hand Limit
Two-Sided Limit
Indeterminate Forms
Does Not Exist (DNE)
KEY TAKEAWAY
SECTION 3
Visual Explanation — The Table-to-Limit Pipeline
The diagram below illustrates the core strategy. We choose a target value c, then build two columns of x-values—one approaching c from the left, the other from the right. For each x-value, we compute f(x). If both columns of outputs converge to the same value L, we estimate that the limit equals L.
Notice several features in the diagram. First, we never evaluate f at x = 2 itself; the limit is entirely about behavior near the point. Second, the spacing of x-values is not uniform—each successive entry is ten times closer to 2 than the previous one, which reveals the convergence pattern more sharply. Third, the outputs from the left (3.999…) and right (4.001…) both trend toward 4, confirming that the two-sided limit exists and equals 4.
SECTION 4
Mathematical Framework
The informal definition underpinning our table-based strategy can be expressed symbolically. While the full epsilon-delta formalism is covered later in the course, understanding its skeleton clarifies why choosing x-values that get progressively closer to c is so effective.
INFORMAL LIMIT DEFINITION
c = the input value we approach; L = the output value the function approaches; x ≠ c emphasizes that the function's value at c is irrelevant to the limit.
ONE-SIDED LIMITS
The two-sided limit exists if and only if L₁ = L₂. In a table, L₁ is the value approached by f(x) for x < c, and L₂ is the value approached for x > c.
TYPICAL TABLE SPACING
Choosing x-values that differ from c by powers of 10 (e.g., 0.1, 0.01, 0.001) makes the convergence pattern easy to read because each row adds one decimal place of precision.
In practice, the table-based method is an approximation: it gives strong numerical evidence for the value of a limit but does not constitute a formal proof. When the AP exam presents a table and asks you to estimate a limit, your job is to identify the value that the output column is stabilizing toward as the input column draws closer to c. If the outputs do not stabilize—if they oscillate, diverge to infinity, or approach different values from the left and right—you should conclude that the limit does not exist or is infinite.
AP EXAM TIP
SECTION 5
Common Table Patterns & Pitfalls
Not every table leads to a clean limit. The diagram below catalogs the four most common outcomes when analyzing a table of values, ranging from a well-behaved convergent limit to oscillatory behavior that signals the limit does not exist. Being able to recognize these patterns quickly is essential for the AP exam.
Pattern ① is the most straightforward and the one the AP exam tests most frequently. Pattern ② arises with piecewise functions or absolute-value expressions. Pattern ③ is characteristic of rational functions with vertical asymptotes, such as f(x) = 1/x². Pattern ④ is rarer on the exam but can appear with pathological functions like sin(1/x); the key diagnostic is that f(x) values show no stabilizing trend no matter how close x gets to c.
PITFALL WARNING
SECTION 6
Worked Example
Consider the function f(x) = (x² − 9)/(x − 3). Direct substitution at x = 3 gives 0/0, an indeterminate form. We build a table to estimate lim x→3 f(x).
Estimating lim x→3 (x² − 9)/(x − 3)
- 1
Step 1 — Recognize the Indeterminate Form
Substituting x = 3 directly: f(3) = (9 − 9)/(3 − 3) = 0/0. This is indeterminate, so the limit may still exist. We proceed by constructing a table of values near x = 3. - 2
Step 2 — Choose x-values Approaching 3 from the Left
We select x = 2.9, 2.99, 2.999, and 2.9999. Computing f(x) at each: f(2.9) = (8.41 − 9)/(2.9 − 3) = (−0.59)/(−0.1) = 5.9; f(2.99) = (8.9401 − 9)/(−0.01) = 5.99; f(2.999) = 5.999; f(2.9999) = 5.9999.Left-hand outputs: 5.9, 5.99, 5.999, 5.9999 → approaching 6 - 3
Step 3 — Choose x-values Approaching 3 from the Right
Select x = 3.1, 3.01, 3.001, and 3.0001. Computing: f(3.1) = (9.61 − 9)/(0.1) = 6.1; f(3.01) = 6.01; f(3.001) = 6.001; f(3.0001) = 6.0001.Right-hand outputs: 6.1, 6.01, 6.001, 6.0001 → approaching 6 - 4
Step 4 — Compare One-Sided Limits
From the left, f(x) → 6. From the right, f(x) → 6. Because both one-sided limits agree, the two-sided limit exists. - 5
Step 5 — State the Conclusion
We estimate lim x→3 (x² − 9)/(x − 3) = 6. As a check, note that x² − 9 factors as (x − 3)(x + 3), so for x ≠ 3, f(x) = x + 3. Substituting x = 3 into the simplified form: 3 + 3 = 6, confirming our table-based estimate.lim x→3 (x² − 9)/(x − 3) = 6
SECTION 7
Strengths & Limitations of Table-Based Estimation
Table-based estimation is a powerful first tool, but like every method it has boundaries. Understanding when it excels and when it can mislead you will make you a more sophisticated problem-solver—and a better test-taker.
| Strengths | Limitations |
|---|---|
| Requires no algebraic manipulation—works even when f(x) is given only as data or a black-box function. | Provides an estimate, not a proof. Numerical evidence can be misleading for functions with erratic behavior near c. |
| Builds intuition for the concept of a limit before formal definitions are introduced. | Rounding errors in decimal computation can obscure the true limit, especially for functions with slow convergence. |
| Immediately reveals whether one-sided limits agree, diverge, or oscillate. | Cannot distinguish a limit of exactly 0 from a limit that is merely very small, unless values are computed to high precision. |
| Highly accessible on a graphing calculator—simply evaluate f at a list of inputs. | A finite table cannot detect infinitely rapid oscillation (e.g., sin(1/x) near 0) without very carefully chosen points. |
Comparison of strengths and limitations of the table-based method for estimating limits.
KEY TAKEAWAY
 Separated measurements leave the behavior between samples undetermined. Two differentiable curves can pass through the same readings while having different derivatives between them.
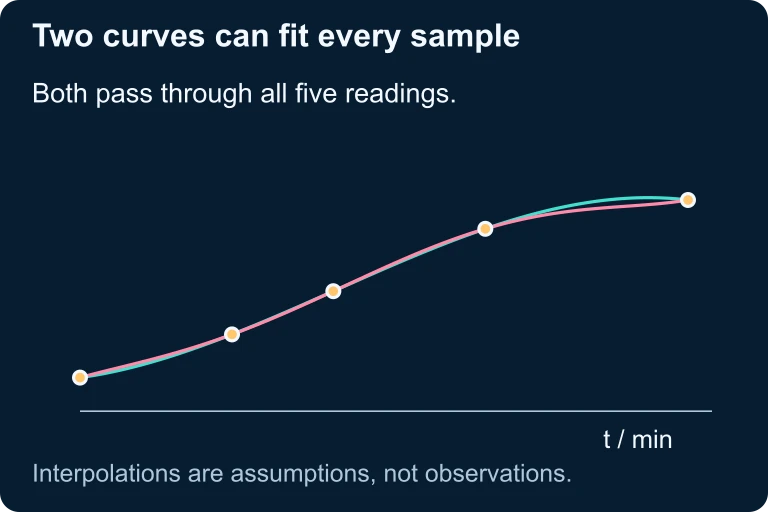 Separated measurements leave the behavior between samples undetermined. Two differentiable curves can pass through the same readings while having different derivatives between them.
SECTION 8
Connections to Advanced Topics
Estimating limits from tables is your entry point into the broader landscape of limit evaluation. As you progress through AP Calculus AB, you will encounter algebraic and analytic methods that complement and extend the numerical approach. The table below maps the journey from table-based estimation to more advanced techniques.
| Table-Based Estimation | Advanced Technique | When to Use |
|---|---|---|
| Observe outputs stabilizing near L | Direct substitution | When f is continuous at c; simply compute f(c) |
| Detect 0/0 form from table behavior | Algebraic simplification | Factor, cancel, then substitute (as in the worked example) |
| Table suggests finite L despite 0/0 | L'Hôpital's Rule | For indeterminate forms 0/0 or ∞/∞ (covered later in the course) |
| Left and right outputs squeeze toward the same L | Squeeze Theorem | Bounding f between two functions that share the same limit at c |
| Graph corroborates table estimate | Graphical estimation | Visual check from the graph of f; often used alongside tables on the AP exam |
How table-based estimation connects to more advanced limit evaluation techniques.
The formal epsilon-delta definition of a limit, which you may encounter in a college calculus course, provides the logical backbone for everything the table suggests numerically. In that framework, for every tolerance ε > 0 on the output, there exists a closeness requirement δ > 0 on the input such that |f(x) − L| < ε whenever 0 < |x − c| < δ. Each row of your table is, in effect, a single (δ, ε) witness pair—a concrete demonstration that the outputs remain near L when the inputs are near c. Mastering table-based estimation now will give you deep conceptual preparation for that formalism.
SECTION 9
Practice Problems
Question 1: CONCEPTUAL
- A. 7
- B. 5
- C. 4.998
- D. 5.002
- E. The limit does not exist.
Show answer (B)
Question 2: BASIC CALCULATION
- A. 0
- B. 0.99833
- C. 1
- D. 0.99998
- E. The limit does not exist.
Show answer (C)
Question 3: INTERMEDIATE
- A. lim x→4 g(x) = 3 and g is continuous at x = 4
- B. lim x→4 g(x) = 3, but we cannot determine continuity from the table alone
- C. lim x→4⁻ g(x) = 2.998 and lim x→4⁺ g(x) = 3.002
- D. The limit does not exist because the table does not include g(4).
- E. lim x→4 g(x) = 4.25
Show answer (B)
Question 4: APPLIED
5 ptsShow answer
Question 5: CRITICAL THINKING
3 ptsShow answer
SUMMARY
Summary
Summary
Estimating limits from tables is a foundational skill in AP Calculus AB. To apply the method, select x-values that approach the target point c from both sides, compute f(x) at each, and observe whether the outputs converge to a single value L. The left-hand limit and right-hand limit must agree for the two-sided limit to exist. Remember that the value of f at c is irrelevant to the limit—only the trend of nearby values matters.
Watch for four key patterns: convergence (limit exists), one-sided disagreement (limit DNE), unbounded growth (outputs → ±∞), and oscillation (no settling). Use powers-of-ten spacing (c ± 0.1, 0.01, 0.001, …) to expose convergence patterns clearly. Finally, treat table estimates as a starting hypothesis and, when possible, confirm with algebraic simplification or the Squeeze Theorem.