
SECTION 1
Historical Context & Motivation
The idea that a quantity can be understood through the continuous accumulation of its rate of change is one of the most profound insights in all of mathematics. Long before formal notation existed, ancient Greek mathematicians such as Eudoxus and Archimedes grappled with the idea of summing infinitely many thin slices to compute areas bounded by curves. Their method of exhaustion foreshadowed the integral by nearly two millennia, demonstrating that area could serve as a measure of accumulated quantity. The leap from static area to dynamic accumulation required centuries of conceptual development, culminating in the work of Newton and Leibniz in the late seventeenth century.
~250 BCE • Archimedes and the Method of Exhaustion
1668 • Newton's Inverse-Tangent Insight
1675 • Leibniz Introduces ∫ Notation
1823 • Cauchy Formalizes the Definite Integral
The central question this lesson addresses is deceptively simple: if you are given the graph of a function f but not its formula, what can you determine about the behavior of the accumulation function F(x) = ∫ from a to x of f(t) dt? In particular, where is F increasing or decreasing, where does it attain relative extrema, and where is it concave up or concave down? Mastering these interpretations is essential for the AP Calculus AB exam, where graphical analysis of accumulation functions appears routinely in both the multiple-choice and free-response sections.
SECTION 2
Core Principles & Definitions
An accumulation function is defined as F(x) = ∫ from a to x of f(t) dt, where a is a fixed lower limit and x is the variable upper limit. The value F(x) represents the net signed area between the graph of f and the t-axis over the interval [a, x]. Because this net area changes as x moves, F is a function of x whose behavior is entirely governed by the integrand f. The Fundamental Theorem of Calculus (Part 1) tells us that F′(x) = f(x), which means the integrand itself acts as the derivative of the accumulation function. This single relationship is the engine that drives every interpretation in this lesson.
F′(x) = f(x)
Sign of f ↔ Monotonicity of F
Zeros of f ↔ Extrema of F
Sign of f′ ↔ Concavity of F
F(a) = 0 Always
KEY TAKEAWAY
SECTION 3
Visual Explanation: From f to F
The diagram below places the graph of f(t) on top and the corresponding accumulation function F(x) = ∫ from 0 to x of f(t) dt on the bottom. Study how each feature of f—its sign, its zeros, and the direction in which it is increasing or decreasing—translates into a specific behavior of F. Colored regions in the upper graph represent the net signed area that has accumulated up to selected x-values, and matching colored dots in the lower graph mark the resulting values of F.
Notice the key correspondence: the sign of f directly controls the monotonicity of F. On the interval where f is positive, each additional sliver of area is a positive contribution to the running total, so F climbs. Once f dips below the horizontal axis, each new sliver subtracts from the total, and F descends. The peak of F aligns exactly with the zero-crossing of f because that is where positive accumulation ends and negative accumulation begins. Additionally, notice that on the interval [0, 2] the curve f is increasing, which means F″ > 0 there and F is concave up; between t = 2 and t = 6, f is decreasing, so F is concave down over that interval.
SECTION 4
Mathematical Framework
The entire analytical toolkit for interpreting accumulation functions rests on the Fundamental Theorem of Calculus and its immediate consequences. We state the key results below with formal notation and then connect each equation to its graphical meaning.
ACCUMULATION FUNCTION DEFINITION
F(x) is the net signed area between the graph of f and the t-axis on the interval [a, x]. Positive regions contribute positively; negative regions contribute negatively.
FIRST DERIVATIVE — FTC PART 1
The rate of change of the accumulated area at any point x equals the height of the integrand at that point. Therefore: F is increasing when f(x) > 0, F is decreasing when f(x) < 0, and F has a critical point when f(x) = 0.
SECOND DERIVATIVE — CONCAVITY
The concavity of F depends on the slope of f. Where f is increasing (f′ > 0), F is concave up. Where f is decreasing (f′ < 0), F is concave down. An inflection point of F occurs where f changes from increasing to decreasing or vice versa—i.e., at a local extremum of f.
RELATIVE EXTREMA TEST
If f changes from positive to negative at c, then F has a relative maximum. If f changes from negative to positive at c, then F has a relative minimum. If f touches zero without changing sign, F has no extremum there.
AP Exam Tip
SECTION 5
Detailed Breakdown: Reading a Graph of f to Sketch F
In practice, the AP exam presents you with a complete graph of f and asks you to extract detailed information about F. The following systematic approach translates every visible feature of the f-graph into a corresponding feature of F. The diagram below summarizes these correspondences in a single reference visual.
When applying this table on the AP exam, work systematically. First, locate every zero of f to identify the critical points of F. Second, determine the sign of f between consecutive zeros to establish where F is increasing and decreasing. Third, identify the intervals on which f itself is increasing or decreasing to determine the concavity of F. Fourth, check whether f has a local extremum at any point—that point is an inflection point of F. Finally, if the problem asks for an absolute maximum or minimum of F on a closed interval, compare the values of F at the critical points and at the endpoints by computing or estimating the net signed areas.
Absolute Extrema Strategy
 For net flow R(t) = 4t − t² gal/min and 10 gal initially, V(t) = 10 + 2t² − t³/3. Volume peaks at t = 4 minutes, when the net rate changes from positive to negative.
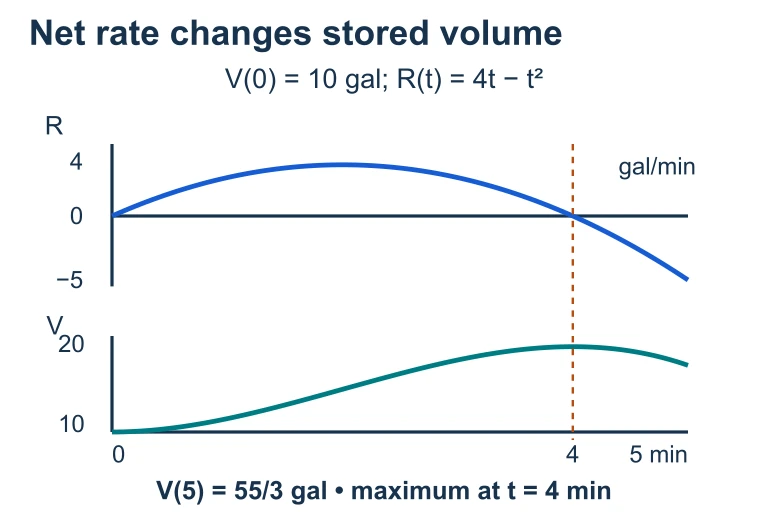 For net flow R(t) = 4t − t² gal/min and 10 gal initially, V(t) = 10 + 2t² − t³/3. Volume peaks at t = 4 minutes, when the net rate changes from positive to negative.
SECTION 6
Worked Example
Suppose f is a continuous function defined on [0, 8] whose graph consists of two semicircles: a semicircle of radius 2 above the t-axis centered at t = 2 on the interval [0, 4], and a semicircle of radius 2 below the t-axis centered at t = 6 on the interval [4, 8]. Let F(x) = ∫ from 0 to x of f(t) dt. Determine: (a) where F is increasing and decreasing, (b) the location and value of any relative and absolute extrema of F on [0, 8], and (c) the intervals where F is concave up and concave down.
Analyzing F from Semicircular f
- 1
Step 1 — Establish Key Features of f
From the description, f(t) > 0 on (0, 4) and f(t) < 0 on (4, 8). The function f equals zero at t = 0, t = 4, and t = 8. The upper semicircle reaches its maximum height of 2 at t = 2, and the lower semicircle reaches its minimum of −2 at t = 6. Since f is the upper half of a circle on [0, 4], f is increasing on [0, 2] and decreasing on [2, 4]. Similarly, f is decreasing on [4, 6] and increasing on [6, 8]. - 2
Step 2 — Determine Where F Is Increasing and Decreasing
Since F′(x) = f(x), F is increasing wherever f(x) > 0 and decreasing wherever f(x) < 0. Therefore, F is increasing on (0, 4) and decreasing on (4, 8).F increasing on (0, 4); F decreasing on (4, 8) - 3
Step 3 — Identify Relative and Absolute Extrema
At x = 4, f changes sign from positive to negative, so F has a relative maximum at x = 4. There is no sign change at x = 0 or x = 8 (these are endpoints). The area of a semicircle of radius 2 is (1/2)π(2)² = 2π. Hence F(4) = ∫₀⁴ f(t) dt = 2π (the area of the upper semicircle). Also, F(0) = 0 and F(8) = 2π + (−2π) = 0 because the negative semicircle has the same area magnitude. Comparing F(0) = 0, F(4) = 2π, F(8) = 0, the absolute maximum is 2π at x = 4, and the absolute minimum is 0 at x = 0 (and also at x = 8).Absolute max: F(4) = 2π ≈ 6.283; Absolute min: F(0) = F(8) = 0 - 4
Step 4 — Determine Concavity of F
Since F″(x) = f′(x), the concavity of F depends on whether f is increasing or decreasing. From Step 1: f is increasing on (0, 2), so F is concave up on (0, 2). f is decreasing on (2, 4), so F is concave down on (2, 4). f is decreasing on (4, 6), so F is concave down on (4, 6). f is increasing on (6, 8), so F is concave up on (6, 8). Thus F has inflection points at x = 2 (where f changes from increasing to decreasing) and at x = 6 (where f changes from decreasing to increasing).Concave up: (0, 2) ∪ (6, 8); Concave down: (2, 6); Inflection points at x = 2 and x = 6
SECTION 7
Common Pitfalls & Misconceptions
| Misconception | Why It's Wrong | Correct Reasoning |
|---|---|---|
| "F has a max where f has a max." | A maximum of f means f′ = 0 there, which gives F″ = 0—an inflection point of F, not an extremum. | F has a max where f = 0 and changes sign from + to −. A max of f is an inflection point of F. |
| "F is negative wherever f is negative." | F(x) is a running total. Even if f < 0 on some interval, F could still be positive there if enough positive area accumulated earlier. | F is decreasing where f < 0, but its value depends on the total net area from a to x. |
| "The graph I'm looking at is F." | AP questions typically display the graph of f and ask about F. Confusing which function you are reading leads to reversed conclusions. | Always identify the given graph. If it's f, you're reading the derivative of F. Heights of f tell you slopes of F. |
| "Area below the axis is negative area, so I subtract its absolute value." | This wording is nearly correct but can cause sign errors. Signed area is automatically handled by the integral. | Integrate directly: regions below the axis contribute negative values naturally. Don't separately compute |area| and then subtract. |
Common student errors when interpreting accumulation functions
KEY TAKEAWAY
SECTION 8
Connection to Advanced Theory
The accumulation-function framework you have mastered in this lesson extends naturally into more advanced topics in calculus and analysis. Understanding how area-based reasoning generalizes prepares you for success in AP Calculus BC and beyond.
| AP Calculus AB (This Lesson) | AP Calculus BC & Beyond |
|---|---|
| F(x) = ∫ₐˣ f(t) dt with constant lower limit a | G(x) = ∫_{g(x)}^{h(x)} f(t) dt with variable limits requires the chain rule: G′(x) = f(h(x)) · h′(x) − f(g(x)) · g′(x) |
| f is continuous on a closed interval [a, b] | Improper integrals: f may be unbounded or the interval may be infinite, introducing convergence questions |
| Signed area under a single curve f(t) | Area between curves, volumes of revolution, and arc length as accumulation functions of geometric quantities |
| Qualitative analysis: increasing, decreasing, concavity | Quantitative analysis via series: Taylor series representations of accumulation functions for approximation |
How accumulation function analysis extends beyond AP Calculus AB
In multivariable calculus and real analysis, the concept of accumulation extends to line integrals, surface integrals, and measure-theoretic integrals. The interpretive skills you develop here—reading a rate function and deducing the behavior of its accumulated total—carry over directly. The language changes, but the core reasoning remains: the sign and trend of the integrand govern the behavior of the accumulated quantity.
SECTION 9
Practice Problems
Question 1: CONCEPTUAL
- A. F has a relative minimum at x = 4.
- B. F has a relative maximum at x = 4.
- C. F has an inflection point at x = 4.
- D. F(4) = 0.
- E. F is concave up at x = 4.
Show answer (B)
Question 2: BASIC CALCULATION
- A. 0
- B. 4.5
- C. 9
- D. 3
- E. 6
Show answer (B)
Question 3: INTERMEDIATE
- A. (−2, 2)
- B. (2, 6)
- C. (2, 14/3)
- D. (−2, 6)
- E. (14/3, 6)
Show answer (C)
Question 4: APPLIED
5 ptsShow answer
Question 5: CRITICAL THINKING
3 ptsShow answer
SUMMARY
Lesson Summary
Summary
An accumulation function F(x) = ∫ₐˣ f(t) dt measures the net signed area between the graph of f and the t-axis from t = a to t = x. By the Fundamental Theorem of Calculus, F′(x) = f(x), so the sign of f determines whether F is increasing or decreasing. Where f crosses zero and changes sign, F attains a relative extremum: positive-to-negative yields a maximum, negative-to-positive yields a minimum.
Because F″(x) = f′(x), the concavity of F mirrors whether f is increasing (concave up) or decreasing (concave down). Inflection points of F occur at the local extrema of f. Always remember that on the AP exam, the graph you are given is typically f—the derivative of the accumulation function F—and you must translate its features into conclusions about F by reading sign, zeros, and monotonicity of f. Mastering this translation is the key to every accumulation function problem.