Variations in
Populations
Explore how genetic variation fuels natural selection and drives the evolution of populations over time.
What Is Genetic Variation?
Genetic variation refers to the differences in DNA sequences among individuals within a population. These differences arise in alleles: the alternative forms of a gene that occupy the same locus on homologous chromosomes.
Sources of Genetic Variation
Phenotypic Variation: Bell Curve
Many traits in a population follow a normal distribution. Most individuals cluster around the mean, with fewer at the extremes. This is the starting point for understanding how selection shifts trait distributions.
The Hardy-Weinberg Principle
The Hardy-Weinberg principle describes a non-evolving population: one where allele and genotype frequencies remain constant across generations. It serves as the null hypothesis for detecting evolution.
Five Conditions for Equilibrium
A population is in Hardy-Weinberg equilibrium only if all five conditions are met. Violating any condition means the population is evolving.
Discrete vs. Continuous Variation
| Discrete | Continuous | |
|---|---|---|
| Definition | Distinct, non-overlapping categories | Range of values along a spectrum |
| Gene control | Usually one or few genes | Polygenic (many genes) |
| Environment effect | Minimal | Significant |
| Distribution | Bar graph (distinct bars) | Bell curve (smooth) |
| Example | Blood type (A, B, AB, O) | Human height, skin color |
Three Modes of Natural Selection
How to Apply Hardy-Weinberg
Example 1: Cystic Fibrosis
In a population of 10,000, 4% are homozygous recessive and express cystic fibrosis. Find the allele and genotype frequencies.
Example 2: Detecting Evolution
In 2000, the frequency of allele A in a beetle population was \( p = 0.6 \). In 2020, it was \( p = 0.8 \). Is this population evolving?
\( p^2 = 0.36 \), \( 2pq = 0.48 \), \( q^2 = 0.16 \)
\( p^2 = 0.64 \), \( 2pq = 0.32 \), \( q^2 = 0.04 \)
Example 3: Genetic Drift in Small Populations
A population of 20 lizards on an island has an allele frequency of \( p = 0.5 \). A hurricane kills 15 randomly. The 5 survivors happen to have \( p = 0.8 \).
The Founder Effect
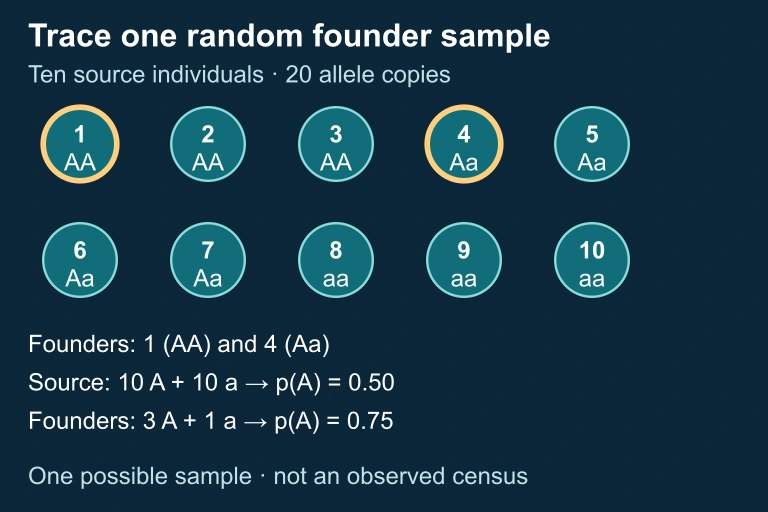
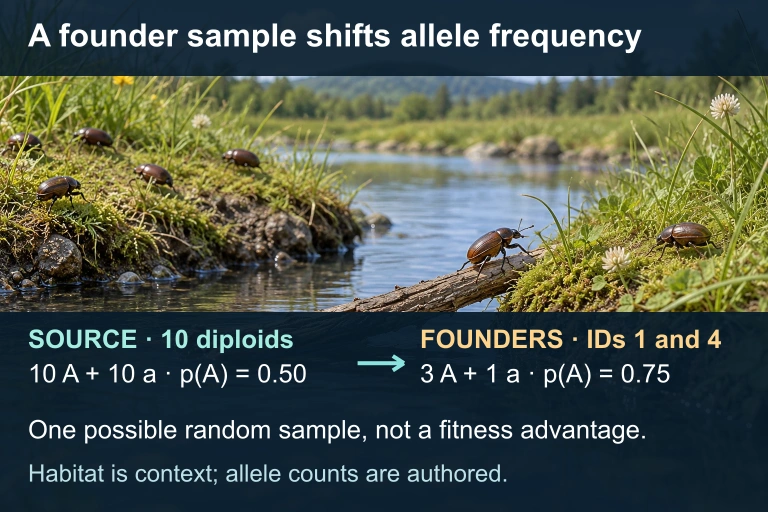
When a small group colonizes a new area, the allele frequencies in the new population may differ drastically from the original. This is another form of genetic drift.
Sexual Selection and Variation
Sexual selection is a form of natural selection in which individuals with certain heritable traits are more likely to obtain mates. It maintains or increases variation in certain traits.
Common Mistakes
Summary: Forces of Evolution
| Force | Effect on Variation | Random? |
|---|---|---|
| Mutation | Increases | Yes |
| Gene flow | Increases (if new alleles) | No |
| Genetic drift | Decreases | Yes |
| Natural selection | Varies by mode | No |
| Non-random mating | Changes genotype frequencies | No |
Question 1 of 5
In a population in Hardy-Weinberg equilibrium, the frequency of the homozygous recessive genotype is 0.09. What is the frequency of the heterozygous genotype?
Question 2 of 5
Which of the following is the ultimate source of all new genetic variation in a population?
Question 3 of 5
A population of birds shows a bimodal distribution for beak size, with birds having either very large or very small beaks surviving best. Which type of selection is operating?
Question 4 of 5
A hurricane destroys 90% of a mouse population at random. The surviving 10% have different allele frequencies than the original population. This is an example of:
Question 5 of 5
Which of the following conditions, if violated, would cause a population to deviate from Hardy-Weinberg equilibrium?