Environmental Impacts on
Enzyme Function
Explore how temperature, pH, and substrate concentration alter the rate of enzyme-catalyzed reactions and why these factors matter in living systems.
What Are Enzymes?
Enzymes are biological catalysts: proteins that speed up chemical reactions without being consumed. They lower the activation energy (\( E_a \)) required for a reaction to proceed, enabling metabolic processes to occur at rates compatible with life.
The Induced Fit Model
Why Does Environment Matter?
Enzyme function depends on the precise 3D shape of the active site, which is maintained by weak interactions: hydrogen bonds, ionic bonds, and hydrophobic interactions. Environmental changes disrupt these bonds, altering shape and function.
Temperature and Reaction Rate
pH and Enzyme Activity
Substrate Concentration and \( V_{max} \)
Denaturation vs Inhibition
| Denaturation | Inhibition | |
|---|---|---|
| Cause | Extreme heat or pH | Specific inhibitor molecule |
| Mechanism | Unfolds 3D structure | Blocks or distorts active site |
| Reversibility | Usually permanent | Often reversible |
| Specificity | Affects all proteins | Targets specific enzymes |
| Example | Cooking an egg | Competitive inhibitor drug |
Competitive vs Non-competitive Inhibition
How to Analyze Enzyme Graphs
Example: Temperature Shift
Cold, heated and recovered: an enzyme experiment with a visible control story
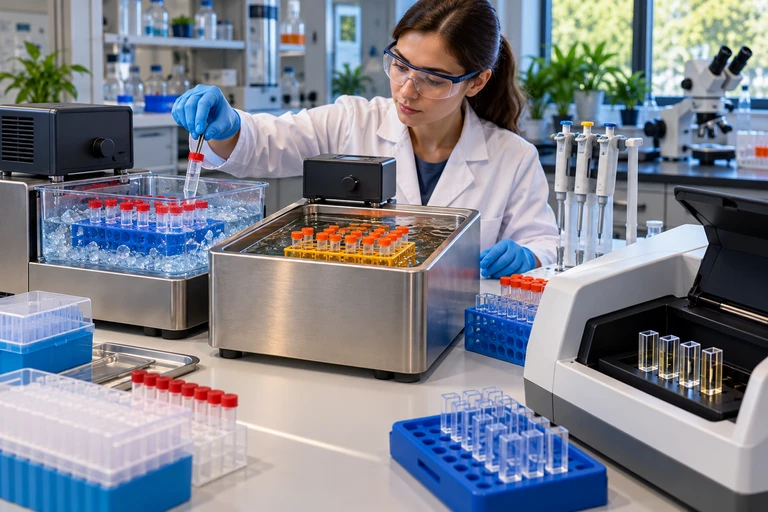 To distinguish prior temperature exposure from immediate reaction conditions, return all enzyme treatments to the same assay temperature and pH. Recovery after cooling differs from persistent activity loss after heating.
Separate treatment from the assay
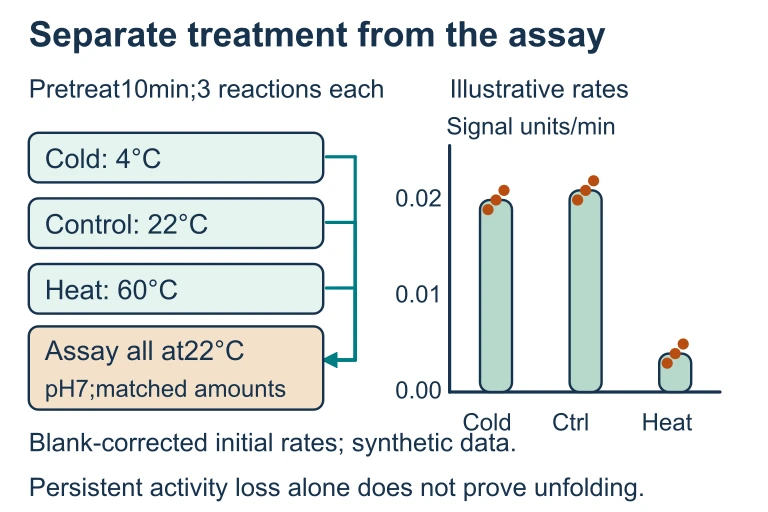 To distinguish prior temperature exposure from immediate reaction conditions, return all enzyme treatments to the same assay temperature and pH. Recovery after cooling differs from persistent activity loss after heating.
Example: Comparing Enzyme pH Optima
A student tests two enzymes, Enzyme X and Enzyme Y, across \(\text{pH}\) values 1 through 12 and records relative activity.
| pH | Enzyme X Activity | Enzyme Y Activity |
|---|---|---|
| 2 | 95% | 5% |
| 4 | 40% | 15% |
| 7 | 5% | 100% |
| 9 | 2% | 60% |
| 12 | 0% | 5% |
Example: Inhibitor Effects on \( K_m \) and \( V_{max} \)
Cofactors and Coenzymes
Many enzymes require non-protein helpers to function. These are essential environmental components that affect whether an enzyme can catalyze its reaction at all.
Allosteric Regulation
Common Mistakes
Summary of Environmental Factors
| Factor | Effect Below Optimum | At Optimum | Effect Above Optimum |
|---|---|---|---|
| Temperature | Low kinetic energy, slow rate | Maximum rate | Denaturation |
| pH | R-group charge altered | Maximum rate | R-group charge altered |
| [Substrate] | Rate increases with [S] | Approaching \( V_{max} \) | Saturation plateau |
Question 1 of 5
An enzyme has an optimal temperature of \(37^\circ\text{C}\). If the temperature is raised to \(70^\circ\text{C}\), what is the most likely result?
Question 2 of 5
Pepsin works optimally at \(\text{pH } 2\). If pepsin is placed in a solution at \(\text{pH } 8\), which of the following best explains the decrease in activity?
Question 3 of 5
In a Michaelis-Menten plot, a competitive inhibitor is added to the reaction. Which parameter changes?
Question 4 of 5
An enzyme-catalyzed reaction reaches a plateau when substrate concentration is continually increased. This plateau occurs because:
Question 5 of 5
In feedback inhibition, the end product of a metabolic pathway inhibits an enzyme early in the pathway. This is an example of: