Energy Flow Through
Ecosystems
Explore how energy enters, moves through trophic levels, and is lost at each step: the foundation of all ecological dynamics.
What is Energy Flow?
Energy flow describes the one-way transfer of energy through an ecosystem, from autotrophs (producers) to heterotrophs (consumers) and ultimately lost as heat. Unlike matter, energy is not recycled: it enters the system primarily as sunlight and exits as thermal energy.
Understanding Trophic Levels
The Sun as the Ultimate Source
The 10% Rule of Energy Transfer
On average, only about \( 10\% \) of the energy at one trophic level is transferred to the next. The rest is lost primarily as heat through metabolic processes (cellular respiration), as well as through incomplete digestion and excretion.
The Ecological Energy Pyramid
An ocean food web has low standing stock but high producer turnover
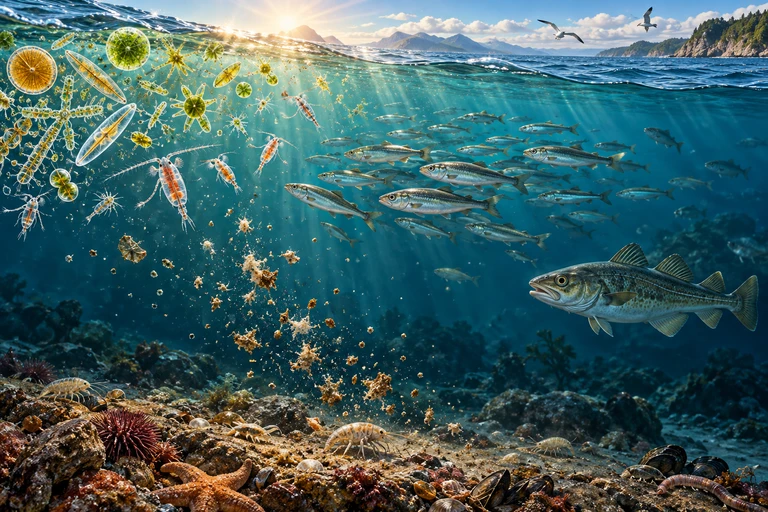 Standing biomass is a stock; production is a rate. Rapid producer turnover can support a larger consumer stock even as energy production decreases between trophic levels.
A stock is not a production rate
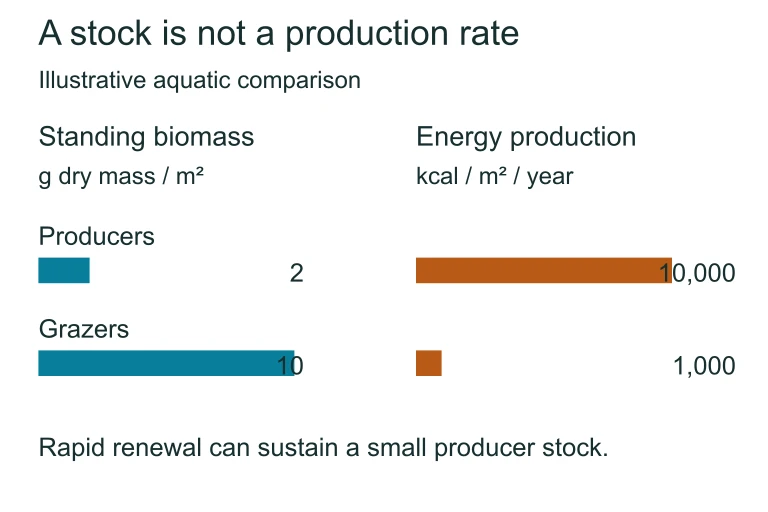 Standing biomass is a stock; production is a rate. Rapid producer turnover can support a larger consumer stock even as energy production decreases between trophic levels.
Food Chains vs Food Webs
| Food Chain | Food Web | |
|---|---|---|
| Structure | Single linear pathway | Interconnected network |
| Complexity | Simple, easy to trace | Complex, realistic |
| Resilience | Fragile: one species removed collapses chain | More stable: alternate pathways exist |
| Energy Tracking | Easy to calculate transfer | Harder: energy splits among pathways |
| Example | Grass → Rabbit → Fox | Multiple producers feeding multiple consumers |
GPP vs NPP: A Key Distinction
Assimilation Efficiency
Not all energy an organism eats (ingested) is actually absorbed. Assimilation efficiency is the fraction of ingested energy that is absorbed across the gut wall. The rest is lost as feces.
How to Solve Energy Transfer Problems
Example 1: Simple Chain
A grassland ecosystem has a net primary productivity of \( 20{,}000 \) kcal/m²/yr. How much energy is available to a tertiary consumer (trophic level 4)?
Example 2: Working Backwards
A hawk (tertiary consumer) requires \( 25 \) kcal/day to survive. Assuming \( 10\% \) transfer efficiency at each level, how much energy must be produced by plants to sustain this hawk?
Example 3: Variable Efficiency
In an aquatic ecosystem, phytoplankton fix \( 50{,}000 \) kcal/m²/yr (GPP). Producer respiration consumes \( 60\% \). Zooplankton (level 2) have \( 15\% \) trophic efficiency. Small fish (level 3) have \( 10\% \). How much energy reaches small fish?
Biomagnification and Energy Flow
While energy decreases at higher trophic levels, toxin concentration increases. Persistent chemicals (DDT, mercury) are not metabolized and accumulate in tissues. Since predators eat many prey organisms, toxins concentrate at each level.
Common Mistakes
Summary of Key Concepts
| Concept | Definition | Key Detail |
|---|---|---|
| GPP | Total energy fixed by producers | Includes respiration |
| NPP | GPP minus producer respiration | Energy available to consumers |
| 10% Rule | ~10% energy transfers per level | Approximate, varies \( 5-20\% \) |
| Energy Pyramid | Visual of energy at each level | Always upright |
| Biomagnification | Toxin concentration increases upward | Opposite pattern to energy |
| Decomposers | Break down dead matter at all levels | Recycle matter, not energy |
Question 1 of 5
If producers in an ecosystem fix \( 50{,}000 \) kcal/m²/yr (GPP) and use \( 55\% \) for respiration, what is the NPP available to consumers?
Question 2 of 5
A food chain has 4 trophic levels. If \( 10{,}000 \) kcal/m²/yr is available at the producer level with \( 10\% \) efficiency at each transfer, how much energy is available to the tertiary consumer?
Question 3 of 5
Which statement best explains why ecological energy pyramids are always upright?
Question 4 of 5
An endotherm at trophic level 3 assimilates \( 500 \) kcal/day and has a production efficiency of \( 2\% \). How much energy is available for growth and reproduction?
Question 5 of 5
A scientist measures that a secondary consumer population contains \( 150 \) kcal/m²/yr of energy. If the trophic efficiency from primary to secondary consumers is \( 12\% \), how much energy was available at the primary consumer level?