Understanding
Biodiversity
Explore the variety of life on Earth: from genes to ecosystems, and why biological diversity is essential for the survival of all living systems.
What Is Biodiversity?
Biodiversity is the variety and variability of life at every level of biological organization. It encompasses differences within species, between species, and across entire ecosystems. The term was coined in 1985 by Walter G. Rosen and popularized by E.O. Wilson.
Three Levels of Biodiversity
Nested scales of biodiversity
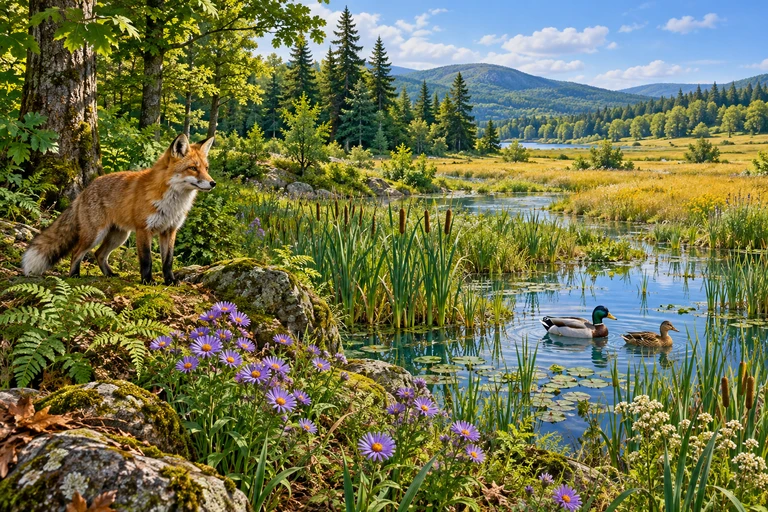
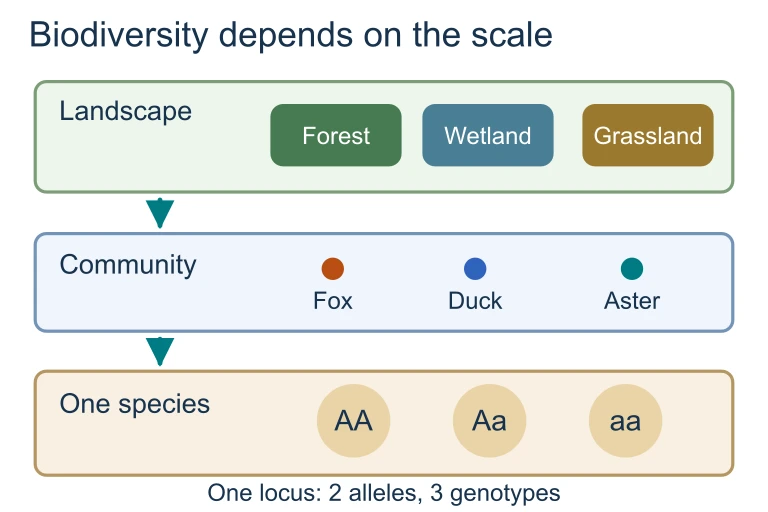
Biodiversity includes ecosystem variety across landscapes, species diversity within communities and genetic variation within a species. At one diploid two-allele locus, AA, Aa and aa are three genotypes formed from two alleles.Biodiversity depends on the scale
Biodiversity includes ecosystem variety across landscapes, species diversity within communities and genetic variation within a species. At one diploid two-allele locus, AA, Aa and aa are three genotypes formed from two alleles.Why Biodiversity Matters
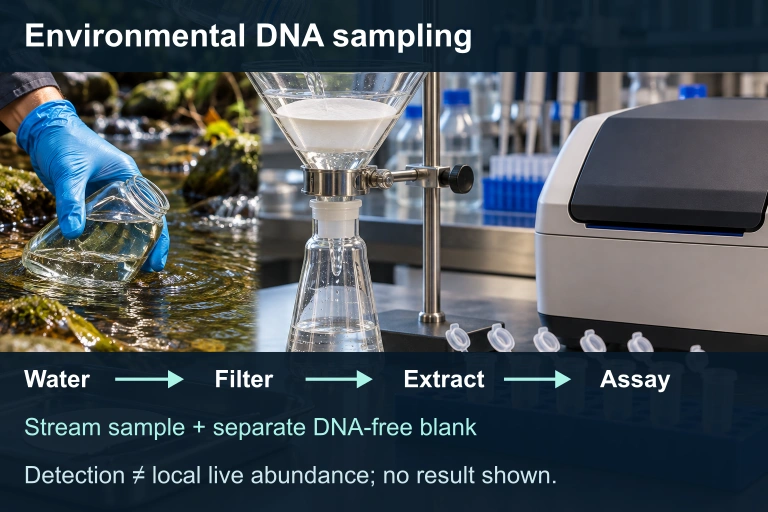
Explain how eDNA can complement direct observation.
A water sample can contain DNA from organisms that are difficult to observe. Transport, persistence and contamination mean detection does not establish live local abundance.
Measuring Species Diversity
Ecologists quantify species diversity using two components: species richness (the total number of species, \( S \)) and species evenness (how equally individuals are distributed among those species). A common index is the Shannon Diversity Index:
Richness vs. Evenness
Richness vs. Evenness: Key Distinction
| Species Richness | Species Evenness | |
|---|---|---|
| Definition | Total number of different species | Relative abundance of each species |
| What it measures | How many species are present | How equally individuals are distributed |
| Symbol | \( S \) | \( E = H' / \ln(S) \) |
| Example | Forest with 50 tree species | Each species has ~2% of individuals |
| Limitation | Ignores relative abundance | Ignores total species count |
How to Calculate \( H' \)
Worked Example: Pond Community
A pond contains 3 species of fish. A sample of \( N = 100 \) individuals gives: Species A = 50, Species B = 30, Species C = 20.
Comparing Two Meadows
Meadow X: 5 species with counts 40, 30, 15, 10, 5 (\( N = 100 \)).
Meadow Y: 5 species with counts 20, 20, 20, 20, 20 (\( N = 100 \)).
| Meadow X | Meadow Y | |
|---|---|---|
| Richness (\( S \)) | 5 | 5 |
| \( H' \) | 1.40 | 1.61 |
| Max \( H' = \ln(5) \) | 1.61 | 1.61 |
| Evenness (\( E \)) | 0.87 | 1.00 |
Species-Area Relationship
Island biogeography predicts that larger areas support more species. The species-area curve follows a power law:
Threats to Biodiversity
Habitat fragmentation, corridors and gene flow
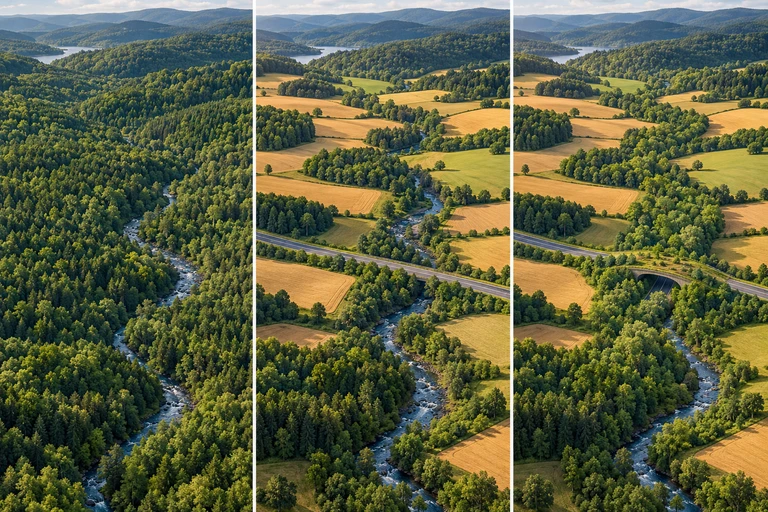
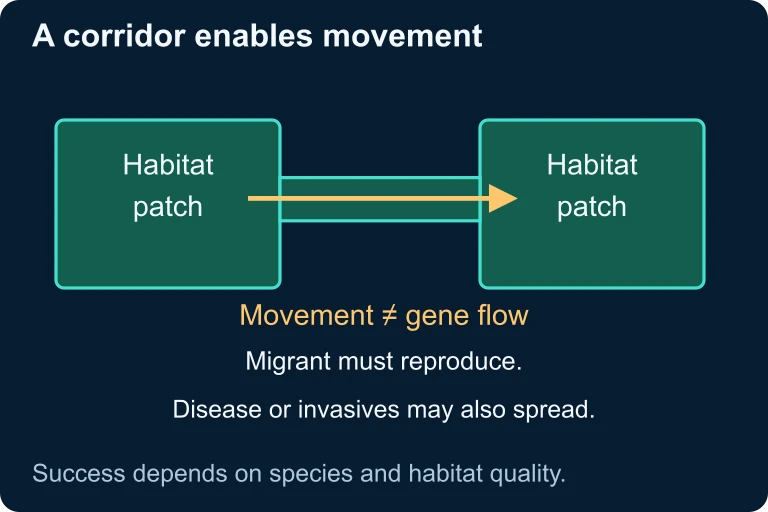
Connected habitat can permit movement; gene flow also requires successful reproduction. Conservation plans balance habitat quality, core area, representation and shared disturbance exposure.A corridor enables movement
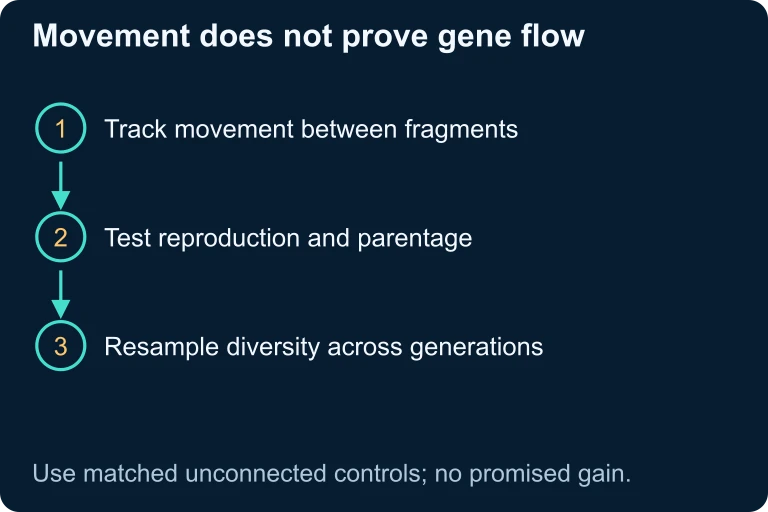
Connected habitat can permit movement; gene flow also requires successful reproduction. Conservation plans balance habitat quality, core area, representation and shared disturbance exposure.Movement does not prove gene flow
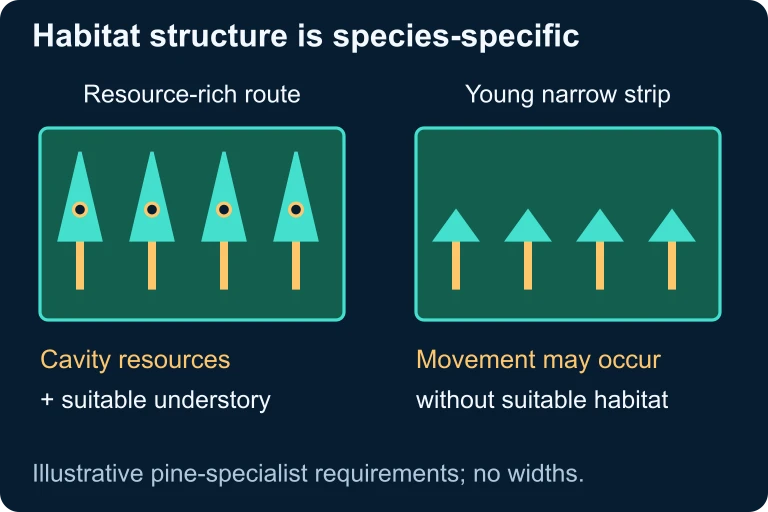
Tracking movement tests connectivity. Parentage and reproduction measurements test gene flow, and repeated genetic sampling tests changes across generations.Habitat structure is species-specific
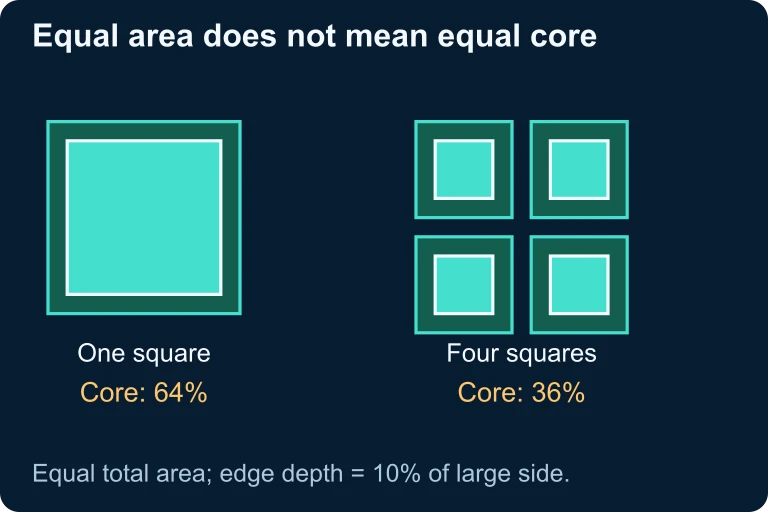
A corridor must provide the resources and habitat structure required by the focal species; movement alone does not establish suitable breeding habitat.Equal area does not mean equal core
For equal total area and a fixed edge depth, one large square retains 64% core habitat while four smaller squares retain 36%.Reserve plans face more than edge effects
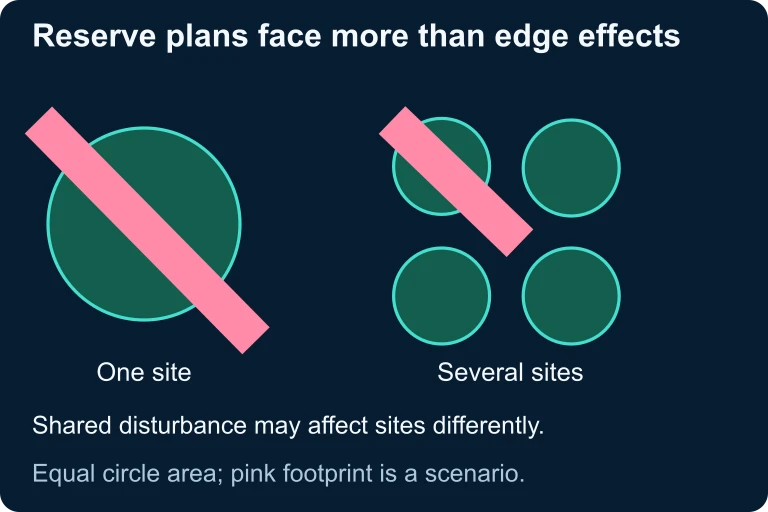
Reserve designs with equal total area can expose habitat to different shared disturbances; site arrangement is another consideration alongside core area.Keystone Species & Trophic Cascades
A keystone species has a disproportionately large effect on its community relative to its abundance. Removing a keystone species triggers a trophic cascade: a chain of effects that ripples through the entire food web.
Biodiversity Hotspots
A biodiversity hotspot is a region that meets two criteria: it contains at least 1,500 endemic vascular plant species, and it has lost at least 70% of its original habitat. Currently, 36 hotspots exist globally.
Common Mistakes
Biodiversity Summary
| Concept | Key Detail | Why It Matters |
|---|---|---|
| Genetic Diversity | Allele variation within populations | Drives adaptation and evolution |
| Species Diversity | Richness + Evenness (\( H' \)) | Measures community health |
| Ecosystem Diversity | Variety of habitat types | Supports functional redundancy |
| Shannon Index | \( H' = -\sum p_i \ln(p_i) \) | Quantitative comparison tool |
| Species-Area | \( S = cA^z \) | Predicts island/fragment richness |
| Keystone Species | Disproportionate ecological role | Removal causes trophic cascades |
Question 1 of 5
A forest community has 4 species with equal abundances of 25 individuals each (\( N = 100 \)). What is the Shannon Diversity Index \( H' \)?
Question 2 of 5
Which of the following best describes a keystone species?
Question 3 of 5
Two communities each have 10 species. Community P has one species comprising 91% of individuals. Community Q has all species at 10% each. Which statement is correct?
Question 4 of 5
A region qualifies as a biodiversity hotspot if it meets which two criteria?
Question 5 of 5
According to the species-area relationship \( S = cA^z \), what happens to species richness when habitat area is reduced by 90% (assuming \( z = 0.3 \))?