
SECTION 1
Historical Context & Motivation
The observation that individuals within a species are not identical has fascinated naturalists for centuries, yet the mechanisms generating and maintaining this phenotypic variation remained elusive until the fusion of Mendelian genetics with Darwinian selection in the early twentieth century. Charles Darwin recognized that heritable variation was the essential raw material for natural selection, but he could not explain how traits were inherited or how new variation arose. The rediscovery of Gregor Mendel's work on discrete hereditary factors, combined with advances in statistics and field ecology, ultimately forged the Modern Synthesis — the intellectual framework that unified genetics, paleontology, and population biology into a coherent theory of evolution. Understanding how variation originates, is distributed, and is acted upon by evolutionary forces remains a cornerstone of modern biology.
1859 • On the Origin of Species
1900 • Rediscovery of Mendel's Laws
1908 • Hardy-Weinberg Principle
1942 • The Modern Synthesis
1968 • Neutral Theory of Molecular Evolution
A central question emerged from this history: if natural selection favors the 'fittest' phenotype, why do populations retain so much genetic variation rather than converging on a single optimal genotype? Answering this question requires examining how mutation, recombination, gene flow, genetic drift, and selection interact to generate and maintain variation at both the genotypic and phenotypic levels.
SECTION 2
Core Principles of Population Variation
Variation in a population refers to the differences in traits — morphological, physiological, behavioral, and molecular — among individuals of the same species. For variation to drive evolution, it must be heritable, meaning it must have a genetic basis that can be transmitted from parent to offspring. Environmental factors can also produce phenotypic variation, but only genetically based differences contribute to evolutionary change across generations.
Mutation
Sexual Reproduction & Recombination
Gene Flow
Genetic Drift
Natural Selection
KEY TAKEAWAY
SECTION 3
Visualizing the Sources of Variation
The diagram above illustrates the relationship between the forces that generate, redistribute, and deplete genetic variation. Mutation is unique in that it is the only mechanism capable of producing new alleles; all other processes act upon pre-existing genetic material. Recombination amplifies the combinatorial possibilities of those alleles through crossing over and independent assortment during meiosis, which is why sexually reproducing species typically harbor far more phenotypic diversity than asexual lineages. Gene flow can either increase or decrease local variation depending on whether incoming alleles are novel or common, while genetic drift tends to erode variation — an effect inversely proportional to population size. Natural selection may increase, decrease, or stabilize variation depending on its mode, a topic we will explore in detail in Section 5.
SECTION 4
Mathematical Framework: Hardy-Weinberg & Measuring Variation
Population genetics provides a quantitative framework for measuring variation and detecting evolutionary change. The Hardy-Weinberg equilibrium serves as the null model: it predicts allele and genotype frequencies in a population where no evolution is occurring. Any statistically significant deviation from Hardy-Weinberg expectations signals that one or more evolutionary forces — mutation, selection, drift, gene flow, or nonrandom mating — are altering the distribution of variation.
HARDY-WEINBERG ALLELE FREQUENCY
For a locus with two alleles: p = frequency of the dominant allele; q = frequency of the recessive allele.
HARDY-WEINBERG GENOTYPE FREQUENCY
p² = frequency of homozygous dominant; 2pq = frequency of heterozygotes; q² = frequency of homozygous recessive.
The five conditions required for Hardy-Weinberg equilibrium — no mutation, random mating, no selection, no genetic drift (infinite population size), and no gene flow — are never perfectly met in nature. Their violation is precisely what makes the model useful: by comparing observed genotype frequencies to Hardy-Weinberg predictions, biologists can infer which evolutionary forces are at work and quantify the extent of their influence.
HETEROZYGOSITY (H)
Expected heterozygosity, where pᵢ is the frequency of the i-th allele at a locus. Higher H indicates greater genetic variation. When H = 0, the population is fixed for a single allele.
AP EXAM TIP
SECTION 5
Modes of Natural Selection and Their Effects on Variation
Natural selection does not always reduce variation. The three classical modes of selection — directional, stabilizing, and disruptive — have qualitatively different effects on the distribution of phenotypic variation within a population. These modes are best understood by visualizing how each shifts or reshapes the bell-shaped normal distribution of a continuous trait.
Additional mechanisms that maintain variation include heterozygote advantage (balancing selection), where the heterozygous genotype has higher fitness than either homozygote — the classic example being sickle-cell trait and malaria resistance. Frequency-dependent selection maintains multiple alleles because the fitness of a phenotype depends on its relative abundance in the population; rare phenotypes often have an advantage (negative frequency dependence), preventing any single allele from reaching fixation. Diploidy itself preserves variation by sheltering recessive alleles from selection when they are present in heterozygotes.
SECTION 6
Worked Example: Hardy-Weinberg Analysis of Variation
A population of 500 wildflowers exhibits two color phenotypes controlled by a single gene with two alleles. Red (R) is dominant to white (r). A field survey counts 80 white-flowered individuals. Determine the allele frequencies and the expected number of heterozygous (carrier) plants under Hardy-Weinberg assumptions.
Hardy-Weinberg Allele & Genotype Frequency Calculation
- 1
Step 1 — Determine q² from phenotype data
White-flowered plants are homozygous recessive (rr). Their frequency is q² = 80 / 500 = 0.16.q² = 0.16 - 2
Step 2 — Solve for q
Take the square root of q²: q = √0.16 = 0.4. This is the frequency of the recessive allele (r) in the population.q = 0.4 - 3
Step 3 — Solve for p
Since p + q = 1, we have p = 1 − 0.4 = 0.6. This is the frequency of the dominant allele (R).p = 0.6 - 4
Step 4 — Calculate heterozygote frequency (2pq)
The frequency of heterozygous individuals is 2pq = 2 × 0.6 × 0.4 = 0.48. This means 48% of the population is expected to be carriers (Rr).2pq = 0.48 - 5
Step 5 — Convert to expected number of individuals
In a population of 500: expected heterozygotes = 0.48 × 500 = 240 plants. We can verify the full distribution: p² × 500 = 0.36 × 500 = 180 (RR); 2pq × 500 = 240 (Rr); q² × 500 = 80 (rr). Total = 180 + 240 + 80 = 500. ✓Expected heterozygotes = 240 plants
NOTE
SECTION 7
Comparing Evolutionary Forces & Their Effects on Variation
| Evolutionary Force | Effect on Variation | Population Size Dependency |
|---|---|---|
| Mutation | Introduces new alleles; always increases variation (slowly) | Independent — rate per gene per generation is constant |
| Recombination | Creates new allele combinations; increases genotypic diversity | Greater effect in large, genetically diverse populations |
| Gene Flow | Increases local variation; homogenizes variation among populations | Most impactful when populations differ in allele frequencies |
| Genetic Drift | Reduces variation by randomly fixing/eliminating alleles | Strongest in small populations (bottleneck/founder effects) |
| Natural Selection | Depends on mode: directional/stabilizing decrease; disruptive/balancing increase | More effective in large populations where drift is minimal |
Summary of evolutionary forces and their effects on genetic variation within and among populations
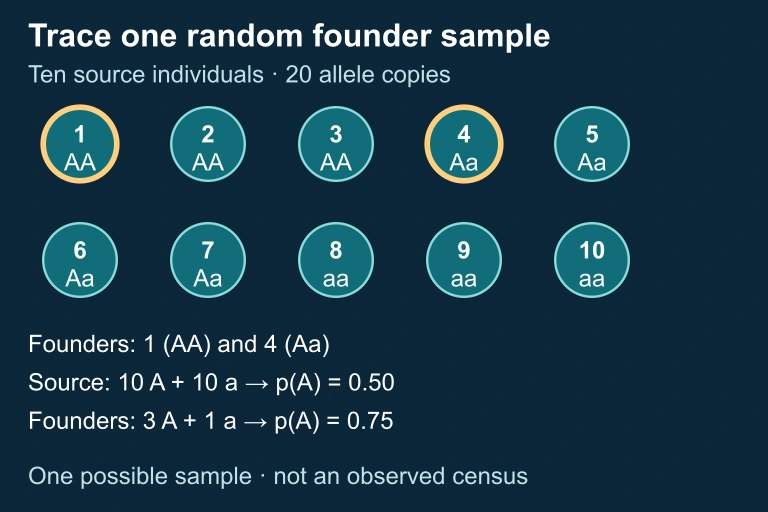 Ten genotypes and founder sample
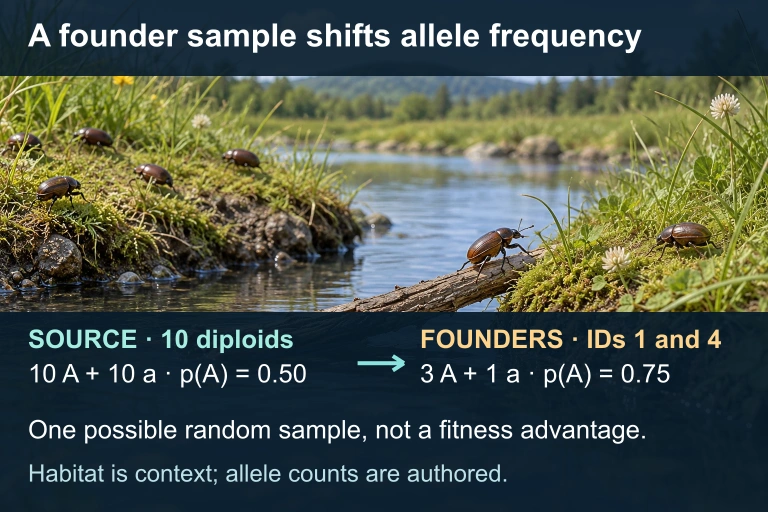 A founder event can change allele frequencies through sampling without a fitness advantage. In this synthetic example, 10 source diploids carry 10 A and 10 a copies; founders 1 and 4 carry 3 A and 1 a. The habitat image is contextual, not a measured sample.
KEY TAKEAWAY
SECTION 8
Connections to Advanced Evolutionary Theory
The study of population-level variation connects directly to several advanced topics that extend beyond the AP Biology curriculum but provide important conceptual depth. Understanding how variation is structured within and among populations is foundational to quantitative genetics, phylogeography, and conservation genetics.
| AP Biology Concept | Advanced Extension |
|---|---|
| Hardy-Weinberg equilibrium as null model | F-statistics (Fₛₜ) quantify population subdivision and divergence among subpopulations |
| Genetic drift in small populations | Effective population size (Nₑ) models predict rate of heterozygosity loss over generations |
| Heterozygote advantage (sickle-cell) | Multi-locus models of balancing selection, including overdominance and antagonistic pleiotropy |
| Phenotypic variation in continuous traits | Genome-wide association studies (GWAS) identify loci contributing to polygenic trait variation |
| Mutations as source of variation | Neutral theory and nearly neutral theory model mutation-drift equilibria at the molecular level |
How AP-level concepts connect to advanced topics in population and evolutionary genetics
In conservation biology, maintaining genetic variation within endangered populations is a primary management goal. Small, isolated populations are susceptible to inbreeding depression — the reduction in fitness caused by increased homozygosity, which exposes deleterious recessive alleles. Strategies such as genetic rescue (introducing individuals from genetically distinct populations to restore heterozygosity) directly apply the principles of gene flow and variation maintenance covered in this lesson. The Florida panther recovery program, in which Texas pumas were introduced to the inbred Florida population, is a celebrated example of applied population genetics.
SECTION 9
Practice Problems
Question 1: CONCEPTUAL
- A. Natural selection
- B. Genetic recombination
- C. Mutation
- D. Genetic drift
Show answer (C)
Question 2: BASIC CALCULATION
- A. 0.18
- B. 0.42
- C. 0.49
- D. 0.30
Show answer (B)
Question 3: INTERMEDIATE
- A. Directional selection
- B. Disruptive selection
- C. Stabilizing selection
- D. Frequency-dependent selection
Show answer (C)
Question 4: APPLIED
4 ptsShow answer
Question 5: CRITICAL THINKING
4 ptsShow answer
SUMMARY
Variations in Populations — Summary
Summary
Genetic variation within populations is the essential raw material for evolution by natural selection. Mutation is the ultimate source of all new alleles, while sexual reproduction and recombination generate novel allele combinations each generation. Gene flow introduces alleles from other populations, and genetic drift stochastically removes alleles — especially in small populations experiencing bottleneck or founder effects.
The Hardy-Weinberg equilibrium (p + q = 1; p² + 2pq + q² = 1) provides the null model for detecting departures caused by evolutionary forces. The three modes of selection reshape phenotypic distributions differently: directional selection shifts the mean, stabilizing selection narrows the distribution, and disruptive selection creates bimodal peaks. Mechanisms like heterozygote advantage, frequency-dependent selection, and diploidy help populations maintain the variation that fuels ongoing adaptation.