
SECTION 1
Historical Context & Motivation
Darwin's theory of evolution by natural selection, published in 1859, offered a compelling mechanism for adaptive change, yet it lacked a coherent model of inheritance. Blending inheritance—the prevailing idea that parental traits mix like paints—would quickly erode the very variation that selection requires. Gregor Mendel's work on discrete hereditary factors went largely unnoticed until its rediscovery in 1900, setting the stage for a synthesis between genetics and evolution. The challenge was mathematical: how could particulate inheritance be reconciled with the gradual, population-level changes Darwin described? Resolving this question gave rise to the field of population genetics, which treats evolution not as a change in individuals but as a shift in allele frequencies within breeding populations over time.
1866 • Mendel's Laws of Inheritance
1908 • Hardy–Weinberg Principle
1930–1932 • The Modern Synthesis Begins
1966 • Lewontin & Hubby — Protein Electrophoresis
2000s–present • Genomic Population Genetics
The central question that population genetics answers is deceptively simple: What causes allele frequencies to change—or remain stable—from one generation to the next? Every evolutionary mechanism—natural selection, genetic drift, mutation, migration, and nonrandom mating—can be understood as a departure from the equilibrium predicted by the Hardy–Weinberg model. By quantifying these departures, biologists gain predictive power over the trajectory of populations, the maintenance of genetic diversity, and the molecular signatures left by adaptation.
SECTION 2
Core Principles of Population Genetics
Population genetics operates at the interface of genetics and evolutionary biology, analyzing how the genetic composition of populations shifts over time. Rather than tracking a single organism's genotype, the field focuses on allele frequencies and genotype frequencies across an entire breeding population, sometimes called a gene pool. The following foundational ideas underpin virtually every analysis in the discipline.
Allele Frequency
Hardy–Weinberg Equilibrium
Genetic Drift
Gene Flow (Migration)
Natural Selection at the Population Level
KEY TAKEAWAY
SECTION 3
Visualizing Allele Frequency & Hardy–Weinberg Equilibrium
The diagram below illustrates how a population's allele frequencies (p and q) translate into the three possible genotype frequencies under Hardy–Weinberg equilibrium. The parabolic curve shows how the frequency of heterozygotes (2pq) is maximized when p = q = 0.5, and how homozygote frequencies change as one allele becomes dominant in the population.
Several features of this graph are worth internalizing. First, heterozygotes are the most common genotype whenever p is between roughly 0.33 and 0.67—this means that in many real populations, carriers of a recessive allele far outnumber homozygous affected individuals. Second, a rare recessive allele (e.g., q = 0.01) produces very few homozygous recessive individuals (q² = 0.0001, or 1 in 10,000), yet the carrier frequency is about 2 × 0.01 × 0.99 ≈ 0.02, or 1 in 50. This discrepancy explains why selection against recessive phenotypes is slow: most copies of the allele hide in heterozygotes.
SECTION 4
Mathematical Framework
The Hardy–Weinberg equations provide the quantitative backbone of population genetics. For a single autosomal locus with two alleles (A and a), let p represent the frequency of allele A and q represent the frequency of allele a. Because there are only two alleles, these frequencies must sum to unity.
ALLELE FREQUENCY IDENTITY
Where p = frequency of the dominant allele (A) and q = frequency of the recessive allele (a). This relationship holds for any two-allele system.
HARDY–WEINBERG GENOTYPE FREQUENCIES
p² = frequency of AA homozygotes; 2pq = frequency of Aa heterozygotes; q² = frequency of aa homozygotes. This equation is derived by expanding (p + q)², reflecting the random union of gametes under HW assumptions.
The Hardy–Weinberg model rests on five assumptions: (1) no mutation introducing new alleles, (2) random mating with respect to the locus in question, (3) no natural selection favoring any genotype, (4) infinitely large population size (no genetic drift), and (5) no gene flow into or out of the population. When any of these conditions is violated, allele frequencies can change across generations—in other words, evolution occurs.
CALCULATING ALLELE FREQUENCY FROM GENOTYPE DATA
Each individual carries two alleles. AA individuals contribute 2 copies of A; heterozygotes contribute 1. Dividing by twice the population size (total allele count) gives the frequency of A.
SELECTION COEFFICIENT AND FITNESS
Where w = relative fitness of a genotype and s = selection coefficient (the proportional reduction in fitness compared to the most-fit genotype, which has w = 1). A lethal genotype has s = 1 (w = 0); a neutral allele has s = 0 (w = 1).
AP EXAM TIP
SECTION 5
Five Agents of Evolutionary Change
Each violation of a Hardy–Weinberg assumption corresponds to an evolutionary mechanism. Understanding how these five forces differ in their directionality, magnitude, and dependence on population size is essential for AP Biology. The diagram below provides a conceptual overview of how each force shifts allele frequencies away from equilibrium.
| Evolutionary Force | Direction | Effect on Variation | Population Size Dependence |
|---|---|---|---|
| Mutation | Random; introduces novel alleles | Increases variation | Weak per generation; rate independent of N |
| Natural Selection | Directional, stabilizing, or disruptive | Can increase or decrease variation | More effective in large N (overwhelms drift) |
| Genetic Drift | Random; unpredictable direction | Decreases variation (fixation/loss) | Strongest in small N |
| Gene Flow | Toward homogenization between populations | Increases within-pop variation; decreases between-pop variation | Depends on migration rate, not N per se |
| Nonrandom Mating | Alters genotype frequencies, not allele frequencies directly | Increases homozygosity (inbreeding); may increase variation in assortative | Independent of N |
Comparison of the five evolutionary forces and their properties
Two special cases of genetic drift merit attention for the AP exam. A bottleneck effect occurs when a population undergoes a drastic reduction in size—due to a natural disaster, disease, or overhunting—so that the surviving gene pool is a small, potentially unrepresentative sample of the original. A founder effect arises when a small group of individuals colonizes a new habitat, carrying with them only a fraction of the genetic diversity of the source population. In both scenarios, rare alleles may be lost or dramatically overrepresented, and the resulting population may differ substantially from Hardy–Weinberg expectations.
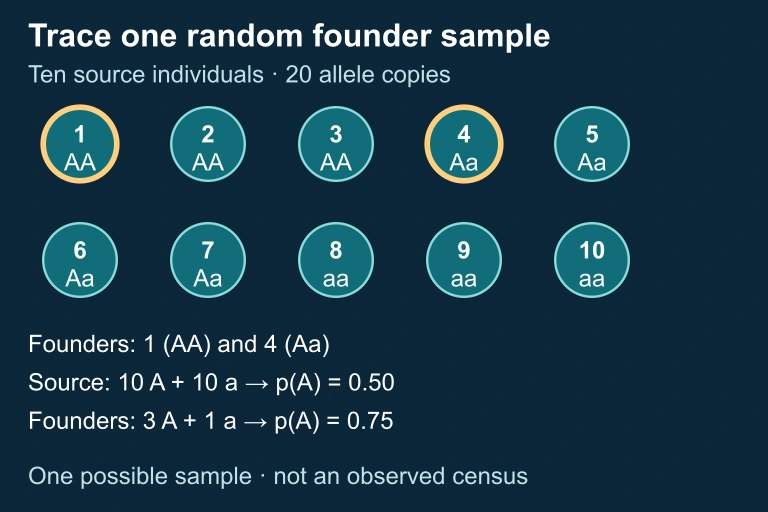 Ten genotypes and founder sample
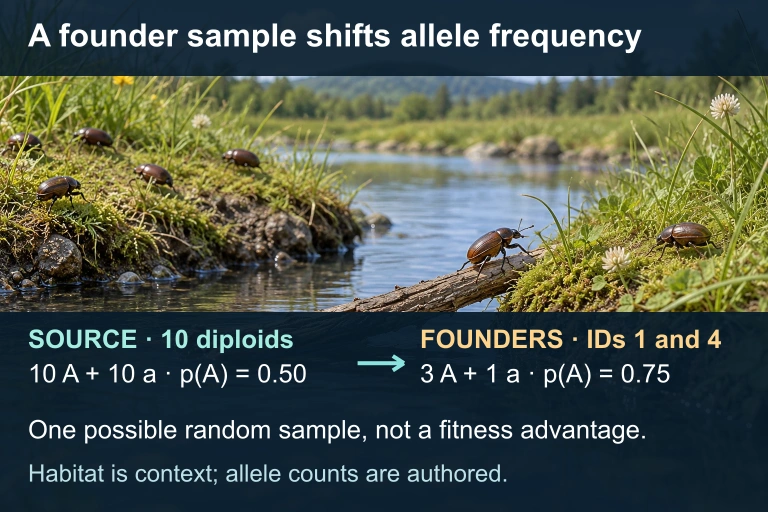 A founder event can change allele frequencies through sampling without a fitness advantage. In this synthetic example, 10 source diploids carry 10 A and 10 a copies; founders 1 and 4 carry 3 A and 1 a. The habitat image is contextual, not a measured sample.
SECTION 6
Worked Example: Applying Hardy–Weinberg
Consider a population of 500 wildflowers exhibiting flower color determined by a single locus with two alleles: C (red, dominant) and c (white, recessive). A survey reveals that 80 plants have white flowers. Determine allele and genotype frequencies assuming Hardy–Weinberg equilibrium, then calculate the expected number of heterozygous plants.
Hardy–Weinberg Calculation: Wildflower Population
- 1
Step 1 — Identify the Known Quantity
White flowers are the recessive phenotype, so white plants have genotype cc. The frequency of the homozygous recessive phenotype is q² = 80 / 500 = 0.16.q² = 0.16 - 2
Step 2 — Find q
Take the square root of q² to obtain the frequency of the recessive allele c: q = √0.16 = 0.4.q = 0.4 - 3
Step 3 — Find p
Since p + q = 1, the frequency of the dominant allele C is p = 1 − 0.4 = 0.6.p = 0.6 - 4
Step 4 — Calculate Genotype Frequencies
Apply the Hardy–Weinberg equation: p² = (0.6)² = 0.36 (frequency of CC); 2pq = 2 × 0.6 × 0.4 = 0.48 (frequency of Cc); q² = 0.16 (frequency of cc). Verify: 0.36 + 0.48 + 0.16 = 1.00 ✓.p² = 0.36, 2pq = 0.48, q² = 0.16 - 5
Step 5 — Expected Number of Heterozygotes
Multiply the heterozygote frequency by the total population: 0.48 × 500 = 240 plants are expected to be heterozygous (Cc). Note that these plants display the dominant red phenotype, yet they each carry one copy of the recessive white allele—making them carriers.Expected heterozygotes = 240 plants
WHY THIS MATTERS
SECTION 7
Strengths and Limitations of the Hardy–Weinberg Model
Like any model in science, Hardy–Weinberg equilibrium is both powerful and limited. Its primary value lies not in describing real populations—few truly meet all five assumptions—but in serving as a rigorous null hypothesis against which observed data can be tested. When genotype frequencies deviate significantly from HW expectations, the model directs investigators toward identifying which evolutionary force is responsible.
| Strengths | Limitations |
|---|---|
| Provides a clear null model: any deviation implies evolution is occurring | Assumes only two alleles at one locus; real traits are often polygenic |
| Allows estimation of carrier frequencies from phenotypic data (useful in medical genetics) | Assumes infinite population size; all real populations are finite and subject to drift |
| Mathematically simple yet widely applicable across diploid organisms | Cannot distinguish among multiple simultaneous violations (e.g., selection + drift) |
| Genotype frequencies reach equilibrium after just one generation of random mating | Assumes non-overlapping generations and no age structure |
Strengths and limitations of the Hardy–Weinberg equilibrium model
KEY TAKEAWAY
SECTION 8
Connections to Advanced Evolutionary Theory
Population genetics provides the theoretical foundation for several advanced topics you may encounter in college-level biology or on the AP exam's more challenging free-response questions. Understanding how basic HW analysis connects to these deeper frameworks strengthens your ability to interpret complex scenarios involving multiple evolutionary forces acting simultaneously.
| Basic Population Genetics (AP Level) | Advanced Extension |
|---|---|
| Two-allele HW model at one locus | Multi-allele and multi-locus models; linkage disequilibrium between loci |
| Directional selection changes allele frequencies | Balancing selection (heterozygote advantage, frequency-dependent selection) maintains polymorphism |
| Genetic drift as random allele frequency change | Effective population size (Nₑ); coalescent theory tracing alleles backward in time |
| Gene flow homogenizes populations | Landscape genetics; FST statistics quantifying population differentiation |
| Fitness (w) and selection coefficient (s) | Quantitative genetics: heritability (h²), response to selection (R = h² × S), polygenic adaptation |
Bridging AP-level population genetics to advanced evolutionary theory
One particularly important extension is heterozygote advantage (also called overdominance), in which heterozygous individuals have higher fitness than either homozygote. The classic example is sickle-cell anemia in regions with endemic malaria: individuals heterozygous for the hemoglobin S allele (HbA/HbS) gain protection from malaria without developing sickle-cell disease. This form of balancing selection maintains both alleles in the population at a stable equilibrium frequency—a phenomenon that straightforward directional selection would not predict. On the AP exam, recognizing when a polymorphism is maintained by heterozygote advantage rather than being driven to fixation can distinguish a strong from a weak response.
LOOKING AHEAD
SECTION 9
Practice Problems
Question 1: CONCEPTUAL
- A. Natural selection must favor the heterozygous genotype.
- B. Individuals must mate randomly with respect to the locus in question.
- C. The population must have undergone a recent bottleneck to establish initial frequencies.
- D. Mutation must continually introduce new alleles to maintain genetic variation.
Show answer (B)
Question 2: BASIC CALCULATION
- A. 0.09
- B. 0.42
- C. 0.30
- D. 0.49
Show answer (B)
Question 3: INTERMEDIATE
- A. Directional natural selection favoring the allele in the island environment
- B. High mutation rate on the island increasing the allele's frequency
- C. Founder effect combined with genetic drift in the small population
- D. Gene flow from the mainland population maintaining the allele at high frequency
Show answer (C)
Question 4: APPLIED
4 ptsShow answer
Question 5: CRITICAL THINKING
4 ptsShow answer
SUMMARY
Population Genetics — Summary
Summary
Population genetics studies how allele frequencies and genotype frequencies change within populations over time, defining evolution at the microevolutionary scale. The Hardy–Weinberg equilibrium model (p² + 2pq + q² = 1) serves as a null hypothesis: allele and genotype frequencies remain constant across generations only when no mutation, no selection, no drift, no gene flow, and random mating are satisfied. Any violation of these assumptions causes evolution.
The five agents of evolutionary change are mutation (introduces new alleles), natural selection (differential fitness drives directional change), genetic drift (random fluctuations strongest in small populations, including bottleneck and founder effects), gene flow (migration homogenizes populations), and nonrandom mating (alters genotype, not allele, frequencies). For the AP exam, master the mathematical workflow—start with q² from the recessive phenotype, solve for q, derive p, calculate all genotype frequencies, and use the chi-square test to evaluate departures from equilibrium.