
SECTION 1
Historical Context & Motivation
Long before biologists could sequence DNA, naturalists recognized that organisms share structural similarities that hint at common descent. The quest to organize life into a coherent hierarchy—one that reflects actual genealogical relationships rather than superficial resemblance—gave rise to the discipline of phylogenetics. Understanding phylogeny is central to modern biology because it provides the framework within which we interpret adaptation, speciation, biogeography, and even disease emergence. Every time a biologist asks "why does this trait exist?" the answer is ultimately rooted in evolutionary history, and phylogenetic trees are the maps we use to trace that history.
1735 • Linnaeus Publishes Systema Naturae
1859 • Darwin's Origin of Species
1950 • Hennig Formalizes Cladistics
1977 • Woese's Three-Domain System
2000s • Genomic Phylogenetics
The central question driving phylogenetics has remained remarkably constant: how can we reconstruct the true pattern of evolutionary branching from the evidence left behind in living and extinct organisms? The tools have evolved—from comparative anatomy to molecular sequences to whole genomes—but the goal of mapping the tree of life endures.
SECTION 2
Core Principles & Definitions
Before reading a phylogenetic tree, you need a working vocabulary. The principles below form the conceptual foundation of every phylogenetic analysis you will encounter on the AP Biology exam and beyond. Each principle connects to a broader evolutionary idea: that species are related through descent with modification and that we can recover those relationships by identifying the right kinds of shared characteristics.
Monophyletic Groups (Clades)
Synapomorphies
Homology vs. Analogy
Parsimony & Maximum Likelihood
Molecular Clocks
KEY TAKEAWAY
SECTION 3
Anatomy of a Phylogenetic Tree
The diagram below illustrates the key structural features of a phylogenetic tree, sometimes called a cladogram when branch lengths are not drawn to scale. Understanding how to read these diagrams is a critical AP Biology skill—questions frequently ask you to identify the most recent common ancestor of two taxa, determine which taxa form a clade, or infer where a particular trait evolved.
When interpreting a phylogenetic tree, remember that the branching pattern (topology) is what conveys evolutionary relationships—not the order of taxa along the tips. Trees can be freely rotated around any node without changing the relationships they depict. Two taxa are most closely related if they share a more recent most recent common ancestor (MRCA) than either does with a third taxon. In the diagram above, Species D and E diverged most recently (pink clade), while the outgroup diverged earliest from all ingroup taxa.
Common AP Pitfall
SECTION 4
How Phylogenies Are Constructed
Building a phylogenetic tree requires selecting informative characters, aligning data across taxa, and applying a tree-selection criterion. At the AP level, you should understand the logic behind two major approaches: maximum parsimony and molecular clock analysis. Both rely on the assumption that organisms sharing more derived features (or fewer sequence differences) diverged more recently.
Maximum Parsimony
The principle of parsimony (Occam's razor applied to phylogenetics) states that the best tree is the one requiring the fewest evolutionary changes to explain the observed character distribution. For a set of aligned DNA sequences, parsimony counts the minimum number of nucleotide substitutions each possible tree topology demands and selects the tree with the lowest total. While parsimony is conceptually elegant, it can be misled by long-branch attraction—a phenomenon in which rapidly evolving lineages are erroneously grouped together because they have independently accumulated similar mutations.
Molecular Clocks
A molecular clock exploits the observation that neutral mutations accumulate at a roughly constant rate in a given gene over time. If two species differ at a certain percentage of nucleotide sites, and the substitution rate is known (often calibrated from the fossil record), the divergence time can be estimated.
MOLECULAR CLOCK DIVERGENCE
where t = time since divergence, d = observed genetic distance (proportion of differing sites), and r = substitution rate per site per unit time. The factor of 2 accounts for independent mutation accumulation in both lineages since divergence.
Data Sources for Phylogenetics
- Morphological data: Skeletal anatomy, embryonic development, and fossil characters. Useful when molecular data are unavailable (e.g., for extinct taxa known only from fossils).
- Molecular sequences: DNA, RNA, or amino acid sequences aligned across taxa. Ribosomal RNA (rRNA) genes are widely used for deep phylogenetics because they evolve slowly and are present in all life.
- Genomic-scale data: Whole-genome comparisons, gene order, presence/absence of retroposons, and synteny blocks provide thousands of phylogenetically informative characters simultaneously.
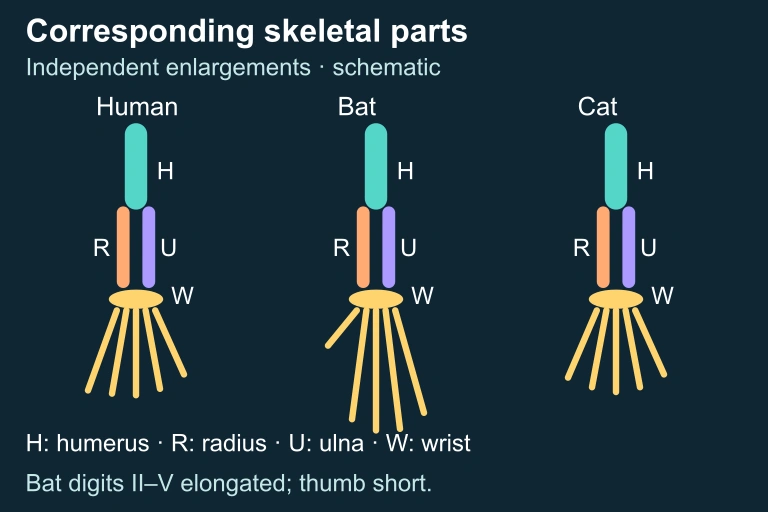 Corresponding skeletal parts
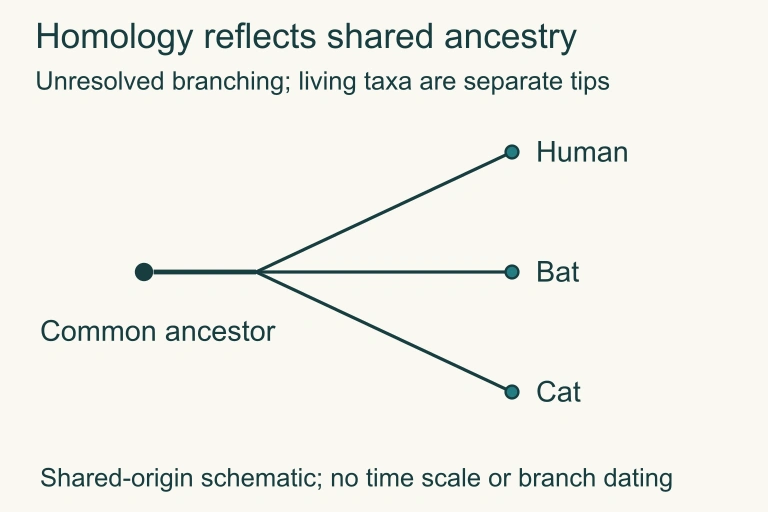 Shared origin schematic
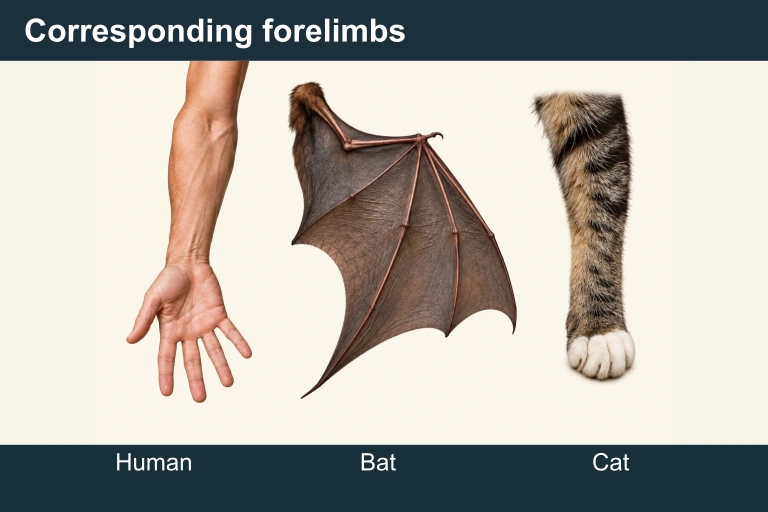 These independently enlarged forelimb topology schematics identify corresponding humerus, radius, ulna, wrist and five digits. They compare homology rather than exact bone shapes or proportions, and do not make living species ancestors of one another.
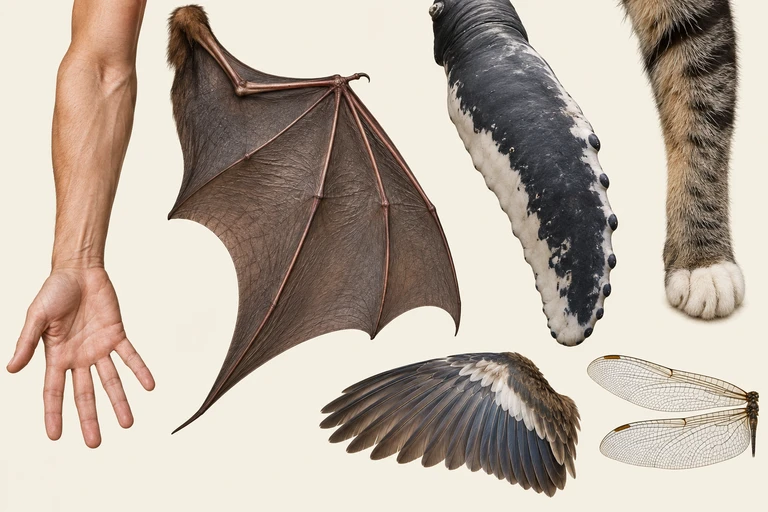 Corresponding forelimb bones reflect shared ancestry despite different functions. Bird and bat forelimb bones are homologous, while bird and insect flight surfaces are analogous.
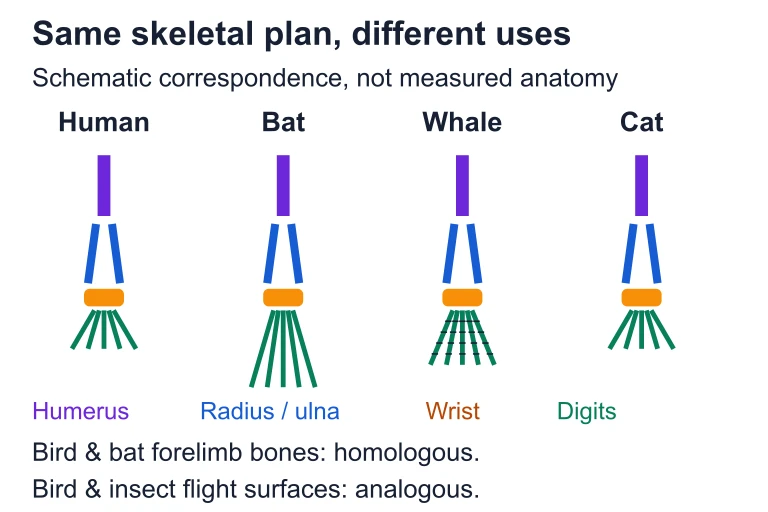 Corresponding forelimb bones reflect shared ancestry despite different functions. Bird and bat forelimb bones are homologous, while bird and insect flight surfaces are analogous.
SECTION 5
Types of Phylogenetic Trees & Key Patterns
Phylogenetic trees come in several varieties, each emphasizing different information. Recognizing which type you are examining is essential for correctly interpreting the data presented on the AP exam. Additionally, certain evolutionary patterns—convergent evolution, divergent evolution, and horizontal gene transfer—can complicate tree interpretation if not accounted for.
| Tree Type | Branch Length Meaning | Best Used For |
|---|---|---|
| Cladogram | Not meaningful; only topology matters | Showing branching order and clade membership |
| Phylogram | Proportional to amount of evolutionary change (e.g., number of substitutions per site) | Comparing rates of evolution across lineages |
| Ultrametric tree (chronogram) | Proportional to time; all tips align at the present | Estimating divergence dates; all extant tips are equidistant from the root |
Comparison of common phylogenetic tree formats
The distinction between homology and analogy is one of the most frequently tested concepts on the AP Biology exam. When constructing or evaluating a phylogeny, only homologous characters inherited from a shared ancestor provide legitimate evidence of relatedness. Analogous characters—those that arose independently via convergent evolution—will mislead phylogenetic analysis if mistaken for homologies. Molecular data are particularly powerful at resolving such ambiguities because convergent evolution is much rarer at the sequence level than at the morphological level.
SECTION 6
Worked Example: Reading a Phylogeny & Estimating Divergence
Suppose you are given a phylogenetic tree of five vertebrate taxa and molecular data indicating that Species X and Species Y differ at 4% of their cytochrome b nucleotide sites. The known substitution rate for cytochrome b is approximately 1 × 10⁻⁸ substitutions per site per year. Determine (a) the sister taxon relationships and (b) the approximate divergence time between X and Y.
Reading a Tree and Applying the Molecular Clock
- 1
Step 1 — Identify Sister Taxa
Sister taxa are two lineages that share a most recent common ancestor (MRCA) not shared with any other taxon. On the tree, find the node connecting Species X and Species Y exclusively. Because no other taxon descends from that node, X and Y are sister taxa. - 2
Step 2 — Identify the Relevant Clade
The clade containing X and Y—plus all descendants of their MRCA—is monophyletic by definition. Any valid grouping in a cladistic analysis must be monophyletic; if we excluded Y from the group, the remaining set would be paraphyletic and therefore invalid. - 3
Step 3 — Set Up the Molecular Clock Equation
We use t = d / (2r), where d = 0.04 (4% divergence) and r = 1 × 10⁻⁸ substitutions per site per year. The factor of 2 accounts for mutations accumulating independently in both lineages since they split. - 4
Step 4 — Calculate Divergence Time
t = 0.04 / (2 × 1 × 10⁻⁸) = 0.04 / (2 × 10⁻⁸) = 2 × 10⁶ years.Species X and Y diverged approximately 2 million years ago. - 5
Step 5 — Evaluate Assumptions
This estimate assumes a constant substitution rate (strict molecular clock). In reality, rates can vary across lineages due to differences in generation time, metabolic rate, and population size. Relaxed molecular clock methods correct for rate variation but are beyond the typical AP exam scope. Fossil calibration points also refine these estimates.
SECTION 7
Strengths & Limitations of Phylogenetic Methods
| Method | Strengths | Limitations |
|---|---|---|
| Maximum Parsimony | Conceptually simple; does not require a model of evolution; works well for closely related taxa with slow evolution | Susceptible to long-branch attraction; can be inconsistent when evolutionary rates vary widely across lineages |
| Maximum Likelihood | Statistically rigorous; incorporates explicit models of nucleotide substitution; handles rate variation | Computationally intensive; results depend on the chosen substitution model |
| Molecular Clock | Provides divergence time estimates; integrates molecular and fossil evidence | Assumes constant substitution rate (strict clock); rate variation requires relaxed clock models and calibration fossils |
| Morphological Cladistics | Applicable to fossils; no DNA required; integrates paleontological data directly | Vulnerable to convergent evolution misleading character analysis; fewer informative characters than molecular data |
Comparison of phylogenetic methods commonly referenced on the AP Biology exam
KEY TAKEAWAY
SECTION 8
Connections to Advanced Evolutionary Theory
Phylogenetics does not exist in isolation—it connects directly to several advanced evolutionary concepts that you may encounter in AP exam free-response questions or in college-level evolutionary biology coursework. Two areas of particular relevance are horizontal gene transfer and phylogenomics.
| Concept | AP-Level Understanding | Advanced Extension |
|---|---|---|
| Horizontal Gene Transfer (HGT) | Genes can transfer between unrelated prokaryotes via transformation, transduction, or conjugation, complicating the tree of life | HGT produces reticulate (network) phylogenies rather than bifurcating trees; phylogenetic networks and reconciliation methods are used to model these events |
| Endosymbiosis | Mitochondria and chloroplasts originated from bacterial endosymbionts; their genomes cluster with α-proteobacteria and cyanobacteria, respectively, on phylogenetic trees | Endosymbiotic gene transfer has moved hundreds of genes from organelle to nuclear genomes, creating chimeric phylogenetic signals within a single organism |
| Phylogenomics | Whole-genome comparisons improve phylogenetic resolution by increasing the number of informative characters | Different genes can yield conflicting tree topologies (gene-tree / species-tree discordance) due to incomplete lineage sorting, duplication, or HGT; coalescent methods reconcile these conflicts |
| Speciation Modes | Phylogenies reveal patterns of allopatric, sympatric, and parapatric speciation based on geographic and genetic data | Species-tree methods combined with biogeographic modeling allow formal statistical tests of alternative speciation hypotheses |
AP-level phylogenetics vs. advanced extensions
As you progress beyond the AP exam, you will encounter phylogenetic trees not as static diagrams but as statistical hypotheses to be tested, refined, and sometimes rejected. The key insight is that phylogeny underpins virtually all of comparative biology: from predicting which species carry zoonotic disease risk, to guiding conservation priorities by identifying evolutionarily distinct lineages, to reconstructing the ancestral states of traits to understand how complex adaptations evolved.
SECTION 9
Practice Problems
Question 1: CONCEPTUAL
- A. Species A is the ancestor of Species B.
- B. Species A and Species B are sister taxa that share a more recent common ancestor with each other than either does with Species C.
- C. Species C evolved before Species A and Species B.
- D. Species A and Species B must be more morphologically similar to each other than either is to Species C.
Show answer (B)
Question 2: BASIC CALCULATION
- A. 1 million years
- B. 2 million years
- C. 4 million years
- D. 20 million years
Show answer (B)
Question 3: INTERMEDIATE
- A. Bats and birds share a recent common ancestor that is not shared with other mammals.
- B. The gene experienced convergent molecular evolution in bats and birds, likely driven by similar selective pressures related to flight.
- C. Horizontal gene transfer occurred between bats and birds.
- D. The molecular clock for this gene runs faster in mammals than in birds.
Show answer (B)
Question 4: APPLIED
4 ptsShow answer
Question 5: CRITICAL THINKING
4 ptsShow answer
SUMMARY
Phylogeny — Key Concepts Review
Summary
Phylogeny reconstructs the evolutionary history of organisms by mapping ancestor–descendant relationships on branching diagrams called phylogenetic trees. Valid evolutionary groupings must be monophyletic (clades), defined by synapomorphies—shared derived characters inherited from a common ancestor. Distinguishing homologous from analogous characters is essential, as only homologies provide genuine evidence of relatedness.
Trees are constructed using morphological and molecular data, analyzed through methods such as maximum parsimony and maximum likelihood. The molecular clock (t = d / 2r) estimates divergence times from sequence data calibrated with fossils. Remember: phylogenetic trees are hypotheses—they are refined as new data emerge, and no single gene or method is infallible. A total evidence approach that integrates multiple data sources yields the most robust reconstruction of the tree of life.