
SECTION 1
Historical Context & Motivation
Gregor Mendel's 1866 publication established the foundational principles of heredity—the laws of segregation and independent assortment—based on his elegant experiments with pea plants. These laws predict discrete phenotypic ratios such as 3:1 and 9:3:3:1, and they remain cornerstones of genetics. However, within a few decades of the rediscovery of Mendel's work in 1900, geneticists began encountering inheritance patterns that deviated markedly from classical predictions. Flower colors blended rather than showing clear dominance, certain traits appeared linked on chromosomes, and some phenotypes seemed to require multiple genes acting in concert. These anomalies did not invalidate Mendelian genetics; instead, they revealed that Mendel had worked with particularly well-behaved traits, and that the broader landscape of heredity was far more complex.
1900 • Rediscovery of Mendel's Laws
1905 • Bateson & Punnett Discover Linkage
1910 • Morgan's White-Eyed Fly
1918 • Fisher's Polygenic Model
1941 • Beadle & Tatum's One Gene–One Enzyme Hypothesis
These discoveries raised a fundamental question: if Mendel's laws describe the behavior of individual alleles at a single locus on separate chromosomes, what happens when alleles at one locus interact in more nuanced ways, when multiple loci contribute to the same phenotype, or when genes reside on the same chromosome? The answers constitute non-Mendelian genetics—a rich set of inheritance patterns that extends, rather than replaces, classical Mendelian principles.
SECTION 2
Core Principles & Definitions
Non-Mendelian inheritance encompasses any pattern in which observed phenotypic ratios deviate from the classic Mendelian predictions of complete dominance at a single autosomal locus with two alleles. Understanding these patterns requires recognizing that dominance relationships, the number of contributing loci, and the chromosomal location of genes all shape phenotypic outcomes. The following core ideas organize the major categories of non-Mendelian inheritance.
Incomplete Dominance
Codominance
Epistasis
Polygenic Inheritance
Sex-Linked & Linked Genes
KEY TAKEAWAY
SECTION 3
Visualizing Dominance Relationships
The distinction between complete dominance, incomplete dominance, and codominance is best understood by comparing the phenotypes of homozygotes and heterozygotes side by side. The diagram below illustrates these three dominance relationships using a single-locus, two-allele model. Observe how the heterozygote phenotype differs in each case—this is the defining feature that distinguishes the patterns.
Notice the critical diagnostic pattern: in complete dominance, you cannot distinguish the heterozygote from the dominant homozygote by phenotype alone—only a test cross or F₂ analysis reveals the hidden recessive allele. In incomplete dominance, the 1:2:1 genotypic ratio becomes a 1:2:1 phenotypic ratio because each genotype class is phenotypically distinct. In codominance, both allele products are simultaneously detectable—the ABO system additionally showcases multiple alleles, since three alleles (Iᴬ, Iᴮ, and i) segregate in the population, even though any individual diploid organism carries only two.
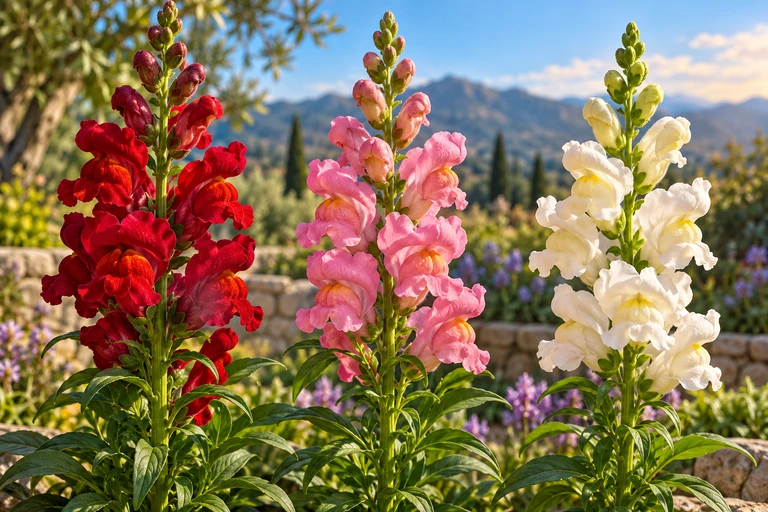 The heterozygote phenotype distinguishes dominance relationships. Snapdragon heterozygotes retain both alleles while producing intermediate color; AB red cells display both A and B carbohydrate antigens.
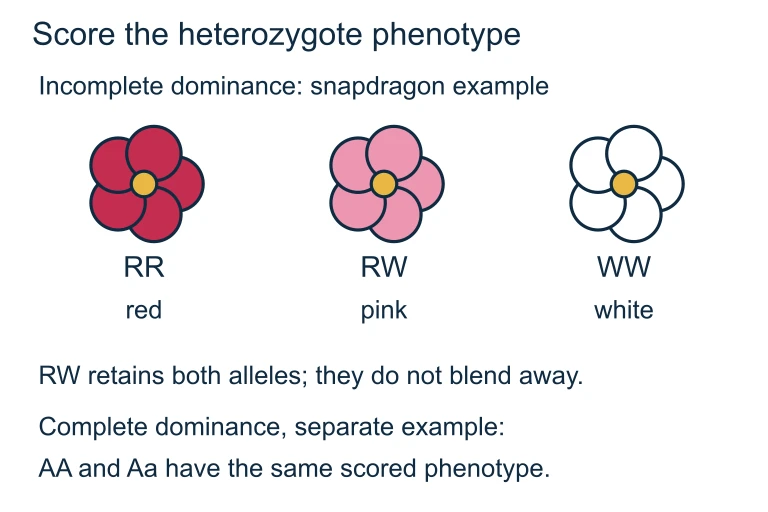 The heterozygote phenotype distinguishes dominance relationships. Snapdragon heterozygotes retain both alleles while producing intermediate color; AB red cells display both A and B carbohydrate antigens.
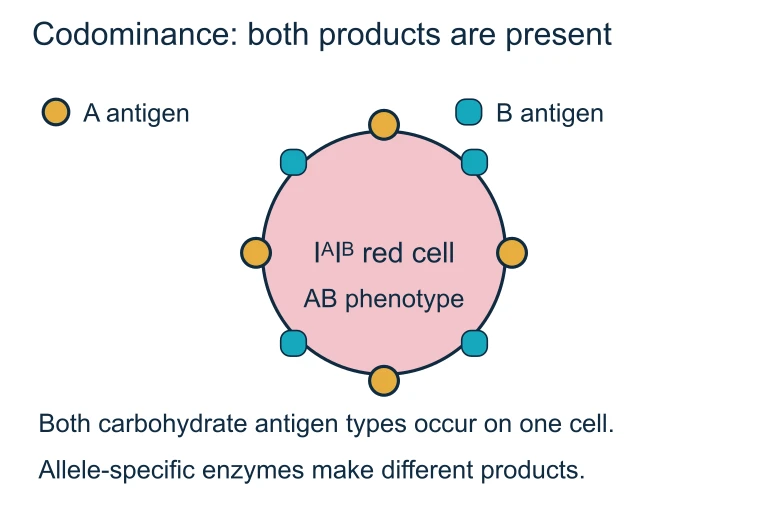 In the AB phenotype, both A and B carbohydrate antigen types occur on the same red cell because both allele-specific enzyme products are expressed.
SECTION 4
Mathematical Framework
Non-Mendelian patterns produce characteristic ratio modifications. Recognizing these modified ratios on the AP Biology exam requires understanding how gene interactions transform the expected 9:3:3:1 dihybrid ratio. Below are the key quantitative relationships you should internalize.
INCOMPLETE DOMINANCE MONOHYBRID F₂ RATIO
When neither allele is dominant, the genotypic ratio equals the phenotypic ratio. Each genotype class produces a distinct phenotype. This is the hallmark of incomplete dominance.
RECESSIVE EPISTASIS (e.g., Labrador Coat Color)
The ee genotype at the extension locus prevents pigment deposition regardless of the genotype at the B locus. The 3 bbee class merges with the 1 BBee class, converting the 9:3:3:1 ratio into 9:3:4.
POLYGENIC TRAIT — NUMBER OF PHENOTYPE CLASSES
For additive polygenic inheritance with two alleles per locus, 2n + 1 gives the number of distinct phenotypic categories. For example, with n = 3 loci for skin color, there are 7 possible phenotype classes (0 to 6 contributing alleles). As n increases, the distribution approaches a continuous normal curve.
RECOMBINATION FREQUENCY & MAP DISTANCE
For linked genes, recombination frequency (RF) estimates map distance in centimorgans (cM). An RF of 50% indicates independent assortment (genes are effectively unlinked). An RF < 50% indicates the genes are on the same chromosome; lower RF means the loci are closer together.
AP EXAM TIP
SECTION 5
Epistasis & Polygenic Inheritance in Detail
While incomplete dominance and codominance modify the relationship between alleles at a single locus, epistasis involves interactions between genes at different loci. In epistasis, the alleles at one locus (the epistatic gene) regulate whether the alleles at another locus (the hypostatic gene) can exert their phenotypic effect. This creates modified Mendelian ratios in dihybrid crosses. Separately, polygenic inheritance describes situations where many genes collectively influence a single trait in an additive fashion, resulting in continuous phenotypic variation rather than discrete categories. Both patterns are pervasive in nature and critical for the AP exam.
| Epistasis Type | Modified Ratio | Example | Mechanism |
|---|---|---|---|
| Recessive Epistasis | 9:3:4 | Labrador coat color | Homozygous recessive at one locus blocks expression at the other |
| Dominant Epistasis | 12:3:1 | Squash fruit color | One dominant allele at the epistatic locus masks expression at the other locus |
| Complementary Genes | 9:7 | Sweet pea flower color | At least one dominant allele at each of two loci required for phenotype expression |
| Duplicate Genes | 15:1 | Wheat kernel color | Either dominant allele alone is sufficient to produce the phenotype |
Common Epistasis Types and Their Modified Dihybrid Ratios
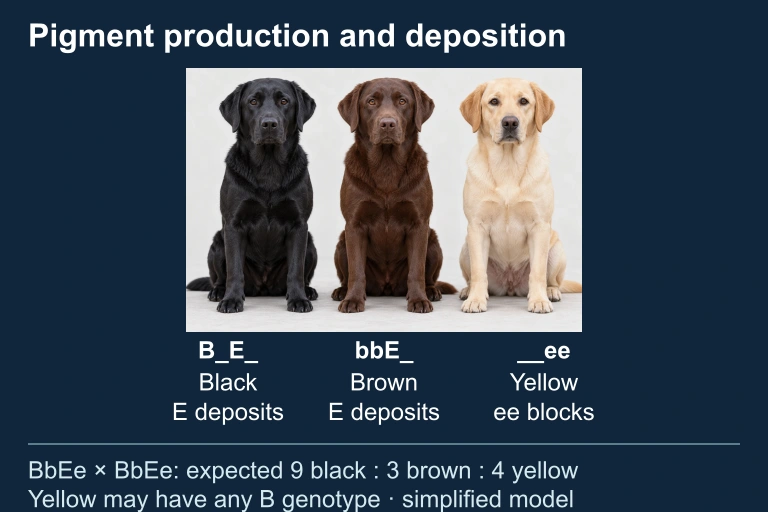 In this simplified coat-color model, pigment deposition can mask differences in pigment production. BbEe × BbEe with independent assortment predicts a 9:3:4 phenotype ratio; yellow does not identify the B genotype. Individual images do not establish genotype.
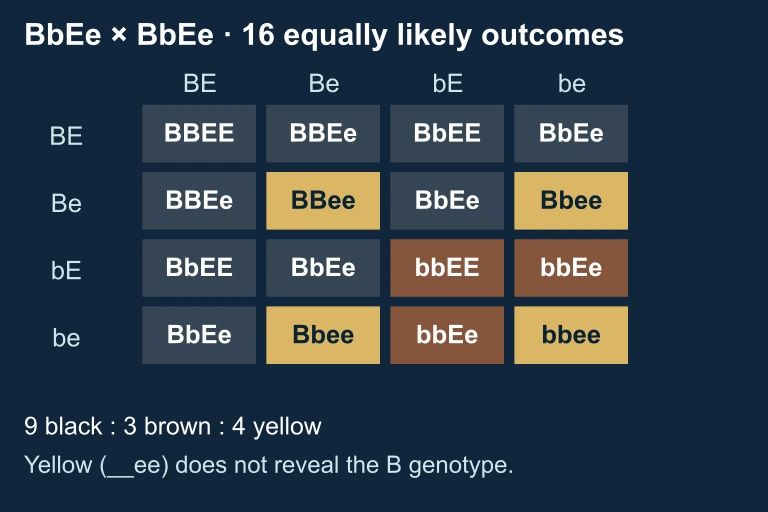 Sixteen gamete combinations
SECTION 6
Worked Example: Predicting Offspring from a Codominance Cross
Consider the following problem: A woman with blood type A (genotype IᴬI) and a man with blood type AB (genotype IᴬIᴮ) have children. What are the expected phenotypic proportions of their offspring's blood types?
ABO Blood Type Cross: IᴬI × IᴬIᴮ
- 1
Step 1 — Identify Parental Genotypes
The mother has blood type A. Since we are told her genotype is IᴬI (she carries one Iᴬ allele and one i allele), she is heterozygous. The father has blood type AB, meaning his genotype must be IᴬIᴮ—he carries one Iᴬ and one Iᴮ allele. Recall that Iᴬ and Iᴮ are codominant to each other, while both are dominant over i. - 2
Step 2 — Determine Gametes
The mother (IᴬI) can produce gametes carrying Iᴬ or i. The father (IᴬIᴮ) can produce gametes carrying Iᴬ or Iᴮ. By the law of segregation, each parent contributes one allele per gamete. - 3
Step 3 — Construct the Punnett Square
Crossing these gametes: IᴬIᴬ (Type A), IᴬIᴮ (Type AB), IᴬI (Type A), and IᴮI (Type B). This yields four genotypic classes in equal proportions of 1/4 each. - 4
Step 4 — Assign Phenotypes Using Dominance Rules
IᴬIᴬ → Type A (A antigens only). IᴬIᴮ → Type AB (both A and B antigens, codominance). IᴬI → Type A (Iᴬ dominant over i). IᴮI → Type B (Iᴮ dominant over i). Combining: Type A appears in 2/4 (50%), Type AB in 1/4 (25%), and Type B in 1/4 (25%). Type O is impossible because neither parent can contribute two i alleles.Expected offspring: 50% Type A, 25% Type AB, 25% Type B, 0% Type O
WHY TYPE O IS IMPOSSIBLE
SECTION 7
Mendelian vs. Non-Mendelian: A Comparative View
A common source of confusion on the AP exam is distinguishing when Mendelian rules apply versus when non-Mendelian modifications must be considered. The table below provides a systematic comparison across the most important parameters. Critically, non-Mendelian patterns do not violate Mendel's laws of segregation and independent assortment at the level of individual alleles—they modify the phenotypic expression of those alleles or introduce additional complexities such as linkage that affect allele co-transmission.
| Feature | Mendelian Genetics | Non-Mendelian Genetics |
|---|---|---|
| Dominance | Complete dominance; heterozygote = dominant phenotype | Incomplete, codominance, or overdominance; heterozygote may differ from both homozygotes |
| Alleles per Gene | Two alleles per gene in the population | Multiple alleles may exist (e.g., ABO: Iᴬ, Iᴮ, i) |
| Genes per Trait | One gene controls one trait | Polygenic: many genes → one trait; Pleiotropy: one gene → many traits |
| Gene Interactions | Genes act independently of each other | Epistasis: genes at different loci interact, modifying phenotypic ratios |
| Chromosomal Behavior | Genes on separate chromosomes assort independently | Linked genes co-segregate; sex-linked genes show sex-specific inheritance |
| Phenotype Distribution | Discrete categories (e.g., tall vs. short) | Continuous variation (bell curve) for polygenic traits; discrete but modified ratios for epistasis |
Mendelian vs. Non-Mendelian Inheritance Patterns
KEY TAKEAWAY
SECTION 8
Connections to Quantitative & Population Genetics
Non-Mendelian genetics provides the conceptual bridge between simple Mendelian inheritance and the more advanced frameworks of quantitative genetics and population genetics that you may encounter in upper-level biology courses or on the more challenging AP exam FRQs. Polygenic traits, when combined with environmental influences, produce the continuous phenotypic variation upon which natural selection acts. Allele frequencies for multiple-allele systems like ABO blood types are analyzed using extensions of the Hardy-Weinberg equilibrium equation, where the binomial expansion is extended to three or more alleles. Understanding linkage and recombination frequencies is foundational for gene mapping, a technique still central to modern genomics.
| Concept in This Lesson | Advanced Extension | Relevance |
|---|---|---|
| Polygenic inheritance | Quantitative trait loci (QTL) analysis | Genome-wide association studies (GWAS) identify loci contributing to complex diseases |
| Multiple alleles (ABO) | Hardy-Weinberg with >2 alleles: (p + q + r)² = 1 | Population-level allele frequency analysis for medical and forensic genetics |
| Gene linkage | Genetic mapping & LOD scores | Constructing chromosomal maps to locate genes relative to each other |
| Epistasis | Gene regulatory networks | Systems biology models of how transcription factors and signaling cascades produce emergent phenotypes |
| Sex-linked inheritance | X-inactivation & dosage compensation | Lyon hypothesis explains mosaic phenotypes in heterozygous females (e.g., calico cats) |
How Non-Mendelian Concepts Connect to Advanced Genetics
On the AP Biology exam, questions about non-Mendelian inheritance frequently intersect with evolution and population genetics. For example, heterozygote advantage (overdominance) in the sickle cell anemia system demonstrates how incomplete dominance at the molecular level translates to a selective advantage in malarial regions, maintaining the HbS allele in the population. These cross-cutting connections exemplify why the College Board tests non-Mendelian genetics not in isolation but as part of the integrative understanding of heredity, gene expression, and evolution.
SECTION 9
Practice Problems
Question 1: CONCEPTUAL
- A. Codominance; 1 red : 2 red-and-white spotted : 1 white
- B. Incomplete dominance; 1 red : 2 pink : 1 white
- C. Complete dominance; 3 red : 1 white
- D. Epistasis; 9 red : 3 pink : 4 white
Show answer (B)
Question 2: BASIC CALCULATION
- A. Type A or Type B only
- B. Type A, Type B, or Type AB
- C. Type A, Type B, Type AB, or Type O
- D. Type AB or Type O only
Show answer (A)
Question 3: INTERMEDIATE
- A. The two genes are linked on the same chromosome.
- B. The B gene shows incomplete dominance.
- C. The aa genotype is epistatic to the B gene, masking its expression.
- D. The A gene is sex-linked, producing skewed ratios in one sex.
Show answer (C)
Question 4: APPLIED
4 ptsShow answer
Question 5: CRITICAL THINKING
4 ptsShow answer
SUMMARY
Summary
Summary
Non-Mendelian genetics encompasses inheritance patterns that extend beyond Mendel's simple model of complete dominance at a single autosomal locus with two alleles. In incomplete dominance, the heterozygote displays an intermediate phenotype, producing a 1:2:1 F₂ ratio. In codominance, both allele products are simultaneously expressed, as in the ABO blood group system with its multiple alleles (Iᴬ, Iᴮ, i). Epistasis involves genes at different loci interacting to modify phenotypic ratios—recessive epistasis yields 9:3:4, dominant epistasis gives 12:3:1, complementary genes produce 9:7, and duplicate genes generate 15:1. Polygenic inheritance explains continuous traits like height and skin color through the additive effects of many loci, with 2n + 1 phenotype classes for n contributing genes.
Linked genes violate independent assortment because they reside on the same chromosome, and their recombination frequency (RF = recombinant offspring / total offspring × 100 cM) estimates map distance. Sex-linked inheritance follows a unique pattern because males are hemizygous for X-linked genes. On the AP exam, recognizing that all modified dihybrid ratios sum to 16 is a powerful diagnostic tool. Throughout, Mendel's laws of segregation and independent assortment remain valid at the molecular level—non-Mendelian patterns emerge from the layered complexity of allelic interactions, inter-locus epistasis, chromosomal linkage, and environmental modifiers acting on top of those foundational rules.