
SECTION 1
Historical Context & Deepening the Framework
While Charles Darwin and Alfred Russel Wallace provided the initial framework for natural selection in the mid-nineteenth century, the theory lacked a mechanism of heredity—a gap that persisted for decades. The rediscovery of Mendelian genetics in 1900, followed by the integration of population genetics in the early twentieth century, transformed natural selection from a qualitative narrative into a quantitative, testable science. This lesson continues from the foundational principles of natural selection and examines how researchers refined the theory by characterizing distinct modes of selection, developing mathematical models of allele frequency change, and amassing diverse lines of empirical evidence from fossils to molecular data.
1900 • Rediscovery of Mendel's Laws
1930–1932 • The Modern Synthesis Begins
1942 • Mayr's Biological Species Concept
1973 • Endler's Guppy Studies Begin
2000s–present • Genomic Era
With this historical trajectory in mind, the central question for this lesson becomes: How do different selective pressures reshape the distribution of phenotypes in a population, and how can we model and detect those changes quantitatively? By the end of this lesson, you should be able to distinguish among directional, stabilizing, and disruptive selection, apply the Hardy-Weinberg equilibrium as a null model, interpret evidence for selection in natural and experimental populations, and connect these ideas to broader evolutionary concepts on the AP Biology exam.
SECTION 2
Core Principles: Modes of Natural Selection
Natural selection acts on the phenotypic variation present in a population, but the resulting evolutionary trajectory depends on which phenotypes confer the greatest fitness advantage in a given environment. Biologists classify the effects of selection on quantitative traits—those governed by multiple loci and showing a continuous distribution—into three primary modes. Each mode produces a characteristic shift in the shape of the trait's frequency distribution across generations, and recognizing these patterns is essential for interpreting data on the AP Biology exam.
Directional Selection
Stabilizing Selection
Disruptive Selection
Sexual Selection
Balancing Selection
KEY TAKEAWAY
SECTION 3
Visual Explanation: Modes of Selection on a Trait Distribution
The diagram above illustrates a central principle: the shape of the fitness function determines which phenotypes are favored and therefore which mode of selection operates. When the fitness landscape is a monotonically increasing or decreasing line, directional selection slides the population's mean toward the optimum extreme. When the landscape peaks in the center, stabilizing selection trims variance. When the landscape has a valley in the middle with peaks on either side, disruptive selection splits the distribution. On the AP exam, you may be presented with fitness curves, survivorship data, or before-and-after phenotype histograms and asked to identify the mode—always look at which phenotypes have the highest relative fitness.
SECTION 4
Mathematical Framework: Hardy-Weinberg as a Null Model
To detect natural selection quantitatively, biologists compare observed allele and genotype frequencies to expectations under the Hardy-Weinberg equilibrium (HWE). HWE serves as a null hypothesis: it predicts the genotype frequencies that would exist in a population experiencing no evolution. When real populations deviate significantly from HWE predictions, one or more evolutionary forces—including natural selection—must be operating. The Hardy-Weinberg model requires five assumptions: no mutation, random mating, no natural selection, infinite population size (no genetic drift), and no gene flow. Violation of any assumption can produce departures from equilibrium, but systematic, directional departures in fitness-related loci are a signature of selection.
HARDY-WEINBERG ALLELE FREQUENCIES
For a single locus with two alleles: p = frequency of the dominant allele, q = frequency of the recessive allele.
HARDY-WEINBERG GENOTYPE FREQUENCIES
p² = frequency of homozygous dominant (AA), 2pq = frequency of heterozygotes (Aa), q² = frequency of homozygous recessive (aa). If selection acts against aa individuals, q² will be lower than predicted.
CHANGE IN ALLELE FREQUENCY UNDER SELECTION
Where s is the selection coefficient against the homozygous recessive genotype (0 ≤ s ≤ 1), and Δq represents the per-generation change in the recessive allele frequency. When s = 1, the aa genotype is lethal; when s = 0, there is no selection.
RELATIVE FITNESS
The relative fitness (w) of a genotype is scaled so that the most-fit genotype has w = 1. A selection coefficient of s = 0.3 means the disfavored genotype has 70% of the fitness of the most-fit genotype.
AP Exam Tip
SECTION 5
Lines of Evidence for Natural Selection
Evolutionary biologists draw on multiple, independent lines of evidence to detect natural selection in wild populations. These lines of evidence converge from different scales—molecular, organismal, and ecological—to build a compelling case that selection is the driving force behind adaptive trait evolution. Understanding these categories of evidence is critical for the AP Biology exam, where free-response questions often ask you to design or interpret studies that test whether selection is operating.
| Evidence Type | Key Example | What It Demonstrates |
|---|---|---|
| Fossil record | Horse limb evolution—gradual reduction from multiple toes to a single hoof over ~55 million years | Directional selection for locomotor efficiency in open grassland environments |
| Molecular (dN/dS) | MHC (major histocompatibility complex) genes showing dN/dS > 1 | Positive selection maintaining high diversity for pathogen recognition |
| Biogeography | Darwin's finches on the Galápagos—13+ species from a common ancestor | Adaptive radiation driven by niche partitioning and ecological opportunity |
| Direct observation | Grant & Grant finch beak measurements during drought years on Daphne Major | Directional selection for larger beaks when only hard seeds were available |
| Comparative anatomy | Vertebrate forelimb homology—human arm, whale flipper, bat wing | Descent with modification; shared ancestry followed by divergent selection pressures |
Summary of evidence types with classic examples
 Compare light and dark models on both substrates, with predator-access and exclusion treatments. Randomized independent enclosures test camouflage-dependent attack rates; reproductive success requires additional evidence.
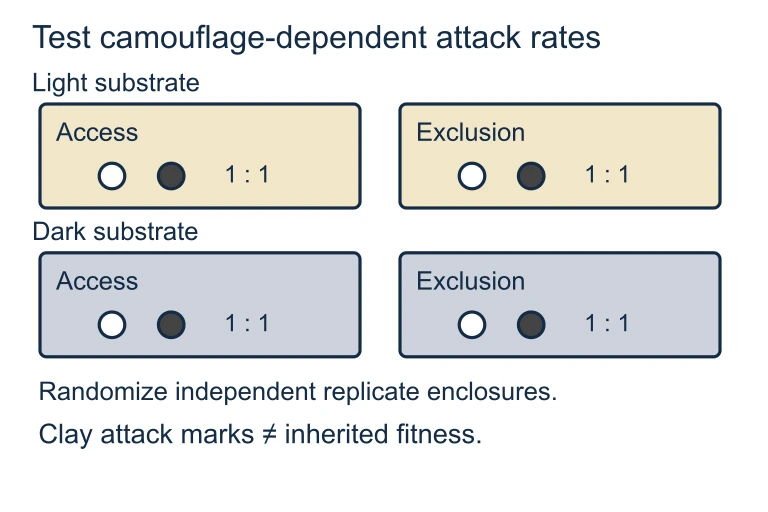 Compare light and dark models on both substrates, with predator-access and exclusion treatments. Randomized independent enclosures test camouflage-dependent attack rates; reproductive success requires additional evidence.
SECTION 6
Worked Example: Detecting Selection with Hardy-Weinberg
Consider a population of 500 wildflowers in which flower color is controlled by a single gene with two alleles: CR (red, dominant) and CW (white, recessive). A census reveals 320 red-flowered and 180 white-flowered individuals. Determine allele frequencies and assess whether the population is in Hardy-Weinberg equilibrium.
Hardy-Weinberg Analysis of Wildflower Color
- 1
Step 1 — Identify Given Values
Total population N = 500. Phenotype counts: 320 red (CRCR + CRCW) and 180 white (CWCW). White flowers are homozygous recessive, so white frequency = q². - 2
Step 2 — Calculate q from q²
q² = 180 / 500 = 0.36. Taking the square root: q = √0.36 = 0.60.q = 0.60 - 3
Step 3 — Calculate p
Since p + q = 1: p = 1 − 0.60 = 0.40.p = 0.40 - 4
Step 4 — Predict HWE Genotype Frequencies
Expected frequencies: p² = (0.40)² = 0.16 (homozygous dominant), 2pq = 2 × 0.40 × 0.60 = 0.48 (heterozygotes), q² = 0.36 (homozygous recessive). Expected counts in N = 500: 80 homozygous dominant, 240 heterozygotes, 180 homozygous recessive. Red phenotype expected: 80 + 240 = 320.Expected: 320 red, 180 white - 5
Step 5 — Compare Observed vs. Expected
Observed: 320 red, 180 white. Expected: 320 red, 180 white. The phenotype counts match HWE predictions exactly. However, because dominance masks genotype differences, a chi-square test on genotype data (if available) would be needed to confirm true equilibrium. With only phenotype data, we cannot distinguish whether heterozygote frequency deviates. In this simplified example, the population is consistent with HWE, suggesting no strong selection at this locus—but the inability to distinguish heterozygotes is a limitation of phenotype-only analysis.Consistent with HWE — no detectable selection using phenotype data alone
Why This Matters
SECTION 7
Selection vs. Other Evolutionary Mechanisms
Natural selection is a powerful evolutionary force, but it is not the only mechanism that changes allele frequencies within populations. The AP Biology exam expects you to distinguish among the five agents of microevolution—natural selection, genetic drift, gene flow, mutation, and nonrandom mating—and to recognize which mechanisms produce adaptive versus non-adaptive change. The table below contrasts natural selection with these other forces along several key dimensions.
| Feature | Natural Selection | Genetic Drift | Gene Flow |
|---|---|---|---|
| Directionality | Directional—shifts allele frequencies toward higher fitness | Random—alleles may increase or decrease by chance | Tends to homogenize allele frequencies among populations |
| Effect on adaptation | The only mechanism that consistently produces adaptation | Can fix deleterious, neutral, or beneficial alleles randomly | May introduce beneficial alleles or disrupt local adaptation |
| Population-size dependence | Effective in large and small populations | Strongest in small populations (bottlenecks, founder effects) | Depends on migration rate, not population size per se |
| Genetic variation | Reduces variation at selected loci (directional); maintains it (balancing) | Reduces variation through random fixation or loss | Increases within-population variation; decreases between-population variation |
| Predictability | Predictable: phenotype-fitness relationships determine outcome | Stochastic: outcomes vary unpredictably among replicates | Semi-predictable: direction depends on source population allele frequencies |
Comparison of three major evolutionary mechanisms
KEY TAKEAWAY
SECTION 8
Connecting to Advanced Evolutionary Theory
The modes and mathematics of natural selection covered in this lesson form the bedrock of several advanced topics you may encounter in college-level evolutionary biology or upper-division ecology courses. Understanding how selection at the population level connects to speciation, coevolution, and evo-devo (evolutionary developmental biology) will give you a broader perspective, even though the AP exam focuses primarily on the mechanisms and evidence themselves.
| This Lesson | Advanced Extension |
|---|---|
| Directional selection shifts mean phenotype | Sustained directional selection can drive speciation if isolated populations experience different directional pressures (allopatric divergence) |
| Disruptive selection produces bimodal distributions | May lead to sympatric speciation if assortative mating evolves between the two phenotypic modes, as modeled in studies of cichlid fishes |
| Balancing selection (heterozygote advantage) | Maintained polymorphisms can be ancient; trans-species polymorphisms in MHC loci predate the divergence of humans and chimpanzees |
| Fitness functions determine mode of selection | Adaptive landscapes (Wright's fitness landscapes) formalize how populations navigate peaks and valleys in multidimensional genotype space |
| Hardy-Weinberg as a null model | Coalescent theory and genome-wide association studies (GWAS) use more sophisticated null models to detect selection at specific genomic loci |
Connections between this lesson and advanced evolutionary topics
Looking forward, the integration of genomics with ecology—sometimes called landscape genomics—is allowing researchers to map selection pressures across geographic space and link specific alleles to environmental gradients such as temperature, altitude, or pathogen prevalence. These approaches reinforce that natural selection is not merely a historical concept but an ongoing, measurable process shaping the biodiversity we observe today.
SECTION 9
Practice Problems
Question 1: CONCEPTUAL
- A. Stabilizing selection
- B. Disruptive selection
- C. Directional selection
- D. Frequency-dependent selection
Show answer (C)
Question 2: BASIC CALCULATION
- A. 160
- B. 320
- C. 480
- D. 640
Show answer (B)
Question 3: INTERMEDIATE
- A. The frequency of HbS would increase because homozygous HbS individuals would no longer be disadvantaged.
- B. The frequency of HbS would decrease because heterozygote advantage would no longer apply, and selection against HbS homozygotes would dominate.
- C. The frequency of HbS would remain stable because allele frequencies do not change once equilibrium is reached.
- D. Disruptive selection would increase phenotypic variance for hemoglobin type.
Show answer (B)
Question 4: APPLIED
4 ptsShow answer
Question 5: CRITICAL THINKING
4 ptsShow answer
SUMMARY
Lesson Summary
Summary
This lesson examined how natural selection operates through three primary modes—directional, stabilizing, and disruptive—each reshaping a population's phenotype distribution in a characteristic way dictated by the underlying fitness function. We also explored sexual selection and balancing selection (including heterozygote advantage) as specialized forms that maintain phenotypic diversity or drive the evolution of elaborate traits.
Quantitatively, the Hardy-Weinberg equilibrium serves as a null model: departures from its predictions (p² + 2pq + q² = 1) signal that evolutionary forces such as selection, drift, or gene flow are at work. Five converging lines of evidence—the fossil record, molecular data, biogeography, direct observation, and comparative anatomy—confirm that natural selection is the sole evolutionary mechanism that consistently produces adaptive evolution, distinguishing it from random processes like genetic drift. For the AP exam, focus on identifying modes of selection from phenotype distribution data, applying Hardy-Weinberg calculations, and designing or interpreting experiments that test for selection in natural populations.