
SECTION 1
Historical Context & Motivation
Before the mid-nineteenth century, inheritance was commonly explained by blending inheritance—the idea that offspring traits are simply an intermediate mixture of parental characteristics, much like blending two colors of paint. This model could not explain why traits sometimes skip generations or why offspring occasionally display characteristics absent in both parents. The need for a particulate, predictive framework for heredity set the stage for one of the most transformative experimental programs in the history of biology.
1856 • Mendel Begins Experiments
1866 • Publication of Results
1900 • Rediscovery
1902 • Chromosome Theory
1909 • Term "Gene" Coined
Mendel's genius lay in choosing an organism with clearly distinguishable, either-or traits and in applying rigorous quantitative analysis to his results. His central question—how are heritable traits transmitted from one generation to the next?—remains the foundational inquiry of genetics. Understanding his laws is essential before exploring extensions such as polygenic inheritance, epistasis, and the molecular basis of gene expression.
SECTION 2
Core Principles & Definitions
Mendelian genetics rests on several interrelated principles that collectively describe how discrete units of heredity—genes—behave during sexual reproduction. Each gene may exist in alternative forms called alleles. Diploid organisms carry two alleles per gene locus, one inherited from each parent. When both alleles at a locus are identical the organism is homozygous; when they differ the organism is heterozygous. The particular combination of alleles constitutes the genotype, while the observable expression of those alleles is the phenotype.
Law of Dominance
Law of Segregation
Law of Independent Assortment
Test Cross
SECTION 3
Monohybrid Cross — Visual Explanation
The Punnett square is the standard graphical device for predicting offspring genotype and phenotype ratios from a given cross. The diagram below illustrates a monohybrid cross between two heterozygous parents (Pp × Pp), where P represents the dominant allele for purple flower color and p represents the recessive allele for white flower color in pea plants.
The Punnett square formalizes the law of segregation by placing each parent's possible gamete types along one axis. Each interior cell represents an equally probable fertilization event. Because each parent can contribute either a P or p allele with equal probability (0.5), the four cells are equiprobable, yielding the expected 1 : 2 : 1 genotypic ratio and, under complete dominance, the classic 3 : 1 phenotypic ratio that Mendel observed in his F2 generation.
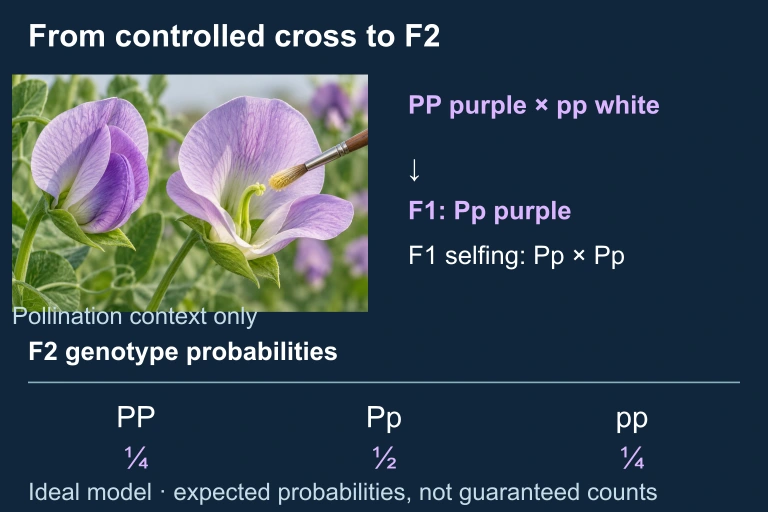 Maternal anthers are removed before unintended self-pollination, then pollen is transferred from the selected donor. In the simplified model, PP purple × pp white produces purple F1 Pp; intentional F1 selfing gives expected F2 probabilities ¼ PP, ½ Pp, ¼ pp, not guaranteed family counts.
SECTION 4
Mathematical Framework
Mendelian inheritance is inherently probabilistic. The rules of probability—specifically the multiplication rule (for independent events occurring together) and the addition rule (for mutually exclusive events)—allow us to calculate expected genotype and phenotype frequencies without drawing every Punnett square.
MULTIPLICATION RULE (AND)
Used when two independent events must both occur. For example, the probability that an offspring receives allele P from parent 1 and allele p from parent 2 is 0.5 × 0.5 = 0.25.
ADDITION RULE (OR)
Used when either of two mutually exclusive outcomes satisfies the condition. For instance, the probability of a heterozygote (Pp) from Pp × Pp is P(P from parent 1 and p from parent 2) + P(p from parent 1 and P from parent 2) = 0.25 + 0.25 = 0.50.
DIHYBRID EXPECTED RATIO
The phenotypic ratio from a dihybrid cross (AaBb × AaBb) under complete dominance and independent assortment. 9/16 show both dominant phenotypes, 3/16 show dominant for trait A and recessive for trait B, 3/16 the reverse, and 1/16 show both recessive phenotypes.
CHI-SQUARE GOODNESS-OF-FIT
Determines whether deviations between observed and expected offspring counts are due to chance or indicate a statistically significant departure from the Mendelian model. Compare the calculated χ² value to the critical value at p = 0.05 with the appropriate degrees of freedom (df = number of phenotypic classes − 1).
SECTION 5
Dihybrid Cross & Independent Assortment
Mendel extended his analysis from single-trait (monohybrid) crosses to two-trait (dihybrid) crosses. When he crossed plants heterozygous for both seed shape (Rr) and seed color (Yy), the F2 generation displayed a 9 : 3 : 3 : 1 phenotypic ratio. This result confirmed that alleles of different genes assort independently during meiosis—the Law of Independent Assortment.
The 9 : 3 : 3 : 1 ratio is a direct consequence of multiplying two independent 3 : 1 ratios: (3 : 1) × (3 : 1) = 9 : 3 : 3 : 1. Any significant deviation from this ratio in experimental data—testable via the chi-square statistic—may indicate that the two genes are linked on the same chromosome or that another non-Mendelian mechanism is operating.
SECTION 6
Worked Example — Chi-Square Analysis
A researcher crosses two heterozygous pea plants (Pp × Pp) and observes the following among 200 offspring: 160 purple-flowered and 40 white-flowered. Do these data support the expected 3 : 1 Mendelian ratio at a significance level of 0.05?
Worked example
- 1
Step 1 — State the Null Hypothesis
H0: The observed offspring ratio does not differ significantly from the expected 3 : 1 ratio. Any deviation is due to chance alone. - 2
Step 2 — Calculate Expected Values
With 200 total offspring and a 3 : 1 ratio, the expected counts are: Purple = (3/4) × 200 = 150; White = (1/4) × 200 = 50.Expected: 150 purple, 50 white - 3
Step 3 — Compute χ² for Each Class
Purple: (160 − 150)² / 150 = 100 / 150 = 0.667. White: (40 − 50)² / 50 = 100 / 50 = 2.000. - 4
Step 4 — Sum to Get Total χ²
χ² = 0.667 + 2.000 = 2.667. Degrees of freedom = number of phenotypic classes − 1 = 2 − 1 = 1.χ² = 2.667, df = 1 - 5
Step 5 — Compare to Critical Value
The critical value for χ² with 1 df at p = 0.05 is 3.841. Because 2.667 < 3.841, we fail to reject H₀. The observed data are consistent with a 3 : 1 Mendelian ratio; deviations can be attributed to random sampling variation.Conclusion: Data support the Mendelian 3 : 1 ratio.
SECTION 7
Strengths & Limitations of Mendelian Genetics
| Strengths | Limitations |
|---|---|
| Provides a simple, predictive mathematical framework for discrete traits governed by single genes. | Cannot explain continuous (quantitative) traits controlled by many genes (polygenic inheritance). |
| Accurately describes complete dominance, which occurs for many loci across diverse organisms. | Does not account for incomplete dominance, codominance, or multiple alleles at a single locus. |
| Independent assortment correctly predicts outcomes for genes on separate chromosomes. | Fails for linked genes on the same chromosome, where recombination frequency varies with map distance. |
| Test crosses allow determination of unknown genotypes, a powerful tool in breeding and research. | Ignores environmental influences on phenotype, epistasis, pleiotropy, and epigenetic modifications. |
Mendelian genetics excels for single-gene traits with complete dominance but must be extended for many real-world inheritance patterns.
SECTION 8
Connection to Non-Mendelian & Molecular Genetics
| Feature | Mendelian (Classical) | Non-Mendelian / Molecular |
|---|---|---|
| Allele interactions | Complete dominance; two alleles per locus | Incomplete dominance, codominance, multiple alleles (e.g., ABO blood types with Iᴬ, Iᴮ, i) |
| Number of genes per trait | One gene → one phenotype | Polygenic traits (e.g., skin color, height); pleiotropy (one gene → many phenotypes) |
| Gene interaction | Genes act independently | Epistasis: one gene masks or modifies expression of another gene (e.g., Labrador coat color) |
| Chromosome behavior | Independent assortment assumed | Linked genes on the same chromosome; recombination frequency used for gene mapping |
| Inheritance pattern | Autosomal; sex not considered | Sex-linked inheritance (X-linked traits), mitochondrial inheritance, genomic imprinting |
Mendelian vs. Non-Mendelian genetics comparison
As you progress through the AP Biology curriculum, you will encounter these extensions in depth. The chromosome theory of inheritance, confirmed by Thomas Hunt Morgan's work with Drosophila, showed that genes are physically located on chromosomes, explaining why some genes violate independent assortment. Later, Watson and Crick's elucidation of DNA structure provided the molecular basis for how alleles encode different polypeptides. Each of these advances is an extension of—not a departure from—Mendel's original insight that heredity is governed by discrete, particulate factors.
SECTION 9
Practice Problems
Question 1: CONCEPTUAL
- A. All tall
- B. 3 tall : 1 short
- C. 1 tall : 1 short
- D. 1 tall : 3 short
Show answer (C)
Question 2: BASIC CALCULATION
- A. 1/16
- B. 1/8
- C. 3/16
- D. 1/4
Show answer (B)
Question 3: INTERMEDIATE
- A. PP
- B. Pp
- C. pp
- D. Either PP or Pp; the data cannot distinguish them
Show answer (B)
Question 4: APPLIED
Show answer
Question 5: CRITICAL THINKING