
AP Biology • Natural Selection

Introduction to Natural Selection

The mechanism by which heritable traits that enhance survival and reproduction become more prevalent across generations.

AP Biology illustration with DNA, a microscope, and a leaf
Inside this lesson 9 sections 5 questions 9 figures

SECTION 1

Historical Context & Motivation

Before the nineteenth century, the prevailing view in Western natural philosophy held that species were fixed and immutable—created in their present forms and unchanged since their origin. Naturalists cataloged an astonishing diversity of organisms, yet lacked a coherent mechanism to explain how that diversity arose. The idea that populations could change over time, known broadly as transmutation, circulated among Enlightenment thinkers such as Erasmus Darwin and Jean-Baptiste Lamarck, but their proposed mechanisms—most notably Lamarck's inheritance of acquired characteristics—failed to withstand empirical scrutiny. The intellectual stage was set for a theory grounded in observable, testable processes.

1798 • Malthus Publishes An Essay on the Principle of Population

Thomas Malthus argued that populations grow geometrically while resources grow arithmetically, inevitably producing a struggle for existence—an insight that would deeply influence Darwin's thinking.

1831–1836 • HMS Beagle Voyage

Charles Darwin observed biogeographic patterns, fossil sequences, and variation among Galápagos finches, accumulating evidence that species were not fixed.

1858 • Darwin–Wallace Joint Presentation

Alfred Russel Wallace independently conceived a theory of natural selection; both papers were read before the Linnean Society, establishing shared priority.

1859 • On the Origin of Species Published

Darwin's landmark book marshaled extensive evidence—from artificial selection, biogeography, embryology, and the fossil record—to argue that natural selection drives the descent of species with modification.

1930s–1940s • The Modern Synthesis

Fisher, Haldane, Wright, Dobzhansky, and Mayr unified Mendelian genetics with Darwinian selection, providing the mathematical and population-genetic foundation for evolutionary biology.

The central question that Darwin and Wallace answered was deceptively simple: if organisms produce more offspring than the environment can support, and if those offspring vary in heritable traits, what determines which individuals survive and reproduce? The answer—natural selection—became the unifying mechanism of evolutionary biology and remains foundational to every topic tested on the AP Biology exam.

SECTION 2

Core Principles of Natural Selection

Natural selection operates whenever four conditions are met simultaneously within a population. These conditions are not abstract postulates; they are empirically verifiable properties of virtually every natural population. Understanding each condition—and why all four must be present—is essential for analyzing AP Biology scenarios that ask you to determine whether natural selection is occurring.

1

Variation

Individuals within a population differ in morphology, physiology, or behavior. Without phenotypic variation, selection has no raw material on which to act.
2

Heritability

At least some of the observed variation must have a genetic basis so that traits can be transmitted from parents to offspring through DNA.
3

Differential Survival & Reproduction

Individuals with certain heritable traits survive to reproductive age and produce more viable offspring than those with alternative traits—this is differential fitness.
4

Overproduction of Offspring

Populations tend to produce more offspring than the environment can sustain, creating competition for limited resources and driving a struggle for existence.

A critical nuance is that natural selection acts on phenotypes—the observable traits of an organism—but the evolutionary consequences accumulate in the genotype frequencies of the population. An individual organism does not evolve; rather, the population evolves as allele frequencies shift over successive generations. This distinction—selection on individuals, evolution in populations—is a frequent source of misconceptions on the AP exam.

SECTION 3

Visualizing Natural Selection

The following diagram illustrates natural selection operating across three generations in a beetle population. The environment favors darker coloration because lighter beetles are more visible to predatory birds. Notice how the frequency of the dark-phenotype allele increases over time even though no new alleles are introduced—the only force at work is differential survival and reproduction.

Natural Selection Across Three GenerationsGeneration 1Generation 2Generation 3Dark: 4/12 (33%)Predation removeslight beetlesDark: 8/12 (67%)SelectioncontinuesDark: 10/12 (83%)LegendLight phenotype (less fit)Dark phenotype (more fit)Bird predation preferentially removes light-colored beetles from the population.Key ObservationNo new alleles are introduced. The dark-allele frequency increases becausedark beetles have higher survival and reproductive success (fitness).
A beetle population under directional selection for dark coloration. Each circle represents an individual; dark circles carry the favored phenotype. Over three generations, the proportion of dark beetles rises from 33% to 83% solely due to differential survival imposed by avian predation.

This diagram captures the essence of what Darwin called descent with modification. The population is not teleologically striving toward darkness; rather, the environment imposes a filter that consistently favors one phenotype. The consequence—an increase in the frequency of alleles coding for dark pigmentation—is what we measure as evolutionary change. Note that if the environment shifted (for example, if the beetles' substrate became lighter), the direction of selection could reverse, demonstrating that natural selection has no intrinsic direction or goal.

SECTION 4

Mathematical Framework: Fitness & Selection

Although natural selection is a qualitative concept, population genetics provides a quantitative framework for predicting how allele frequencies change. Two key quantities—absolute fitness and relative fitness—allow us to model the rate at which natural selection shifts allele frequencies. The Hardy-Weinberg equation provides the null model against which selection is measured, and the selection coefficient quantifies the magnitude of the selective disadvantage.

HARDY-WEINBERG EQUILIBRIUM

p2+2pq+q2=1p² + 2pq + q² = 1

p = frequency of dominant allele; q = frequency of recessive allele; p + q = 1. This equation predicts genotype frequencies in a population experiencing no evolution—deviations indicate that one or more evolutionary forces (including natural selection) are operating.

RELATIVE FITNESS

w=(absolutefitnessofgenotype)/(maximumabsolutefitnessinpopulation)w = (absolute fitness of genotype) / (maximum absolute fitness in population)

Relative fitness (w) is scaled so the most-fit genotype has w = 1. For example, if genotype AA produces 10 offspring on average and genotype aa produces 8, then wAA = 1.0 and waa = 0.8.

SELECTION COEFFICIENT

s=1−ws = 1 − w

The selection coefficient (s) measures the reduction in fitness of a genotype relative to the fittest genotype. If waa = 0.8, then s = 0.2, meaning the aa genotype suffers a 20% fitness disadvantage.

CHANGE IN ALLELE FREQUENCY (SELECTION AGAINST RECESSIVE HOMOZYGOTE)

Δq=−spq2/(1−sq2)Δq = −spq² / (1 − sq²)

Δq = change in frequency of recessive allele per generation; s = selection coefficient against aa; p and q are current allele frequencies. This formula shows that selection against a recessive allele slows dramatically as q decreases because the allele is hidden in heterozygotes.

ℹ
AP EXAM TIP

SECTION 5

Types of Natural Selection

Natural selection does not always push a trait in one direction. Depending on the relationship between phenotype and fitness, selection can reshape the distribution of traits in a population in three distinct patterns: directional selection, stabilizing selection, and disruptive selection. Each produces a characteristic shift in the population's phenotypic distribution, and distinguishing among them is a high-yield skill on the AP exam.

Three Modes of Natural SelectionDirectionalPhenotype →FrequencyAfterBeforeCurve shifts towardone extreme phenotypeStabilizingPhenotype →Extremes eliminated;intermediate favoredDisruptivePhenotype →Intermediate eliminated;both extremes favoredClassic ExamplesDirectionalPeppered moths duringIndustrial Revolution:dark morphs favoredon soot-covered treesStabilizingHuman birth weight:very low and very highweights associated withhigher infant mortalityDisruptiveAfrican seedcrackerfinches: large and smallbills favored; intermediatebills are disadvantagedDashed curves = original distribution | Solid curves = distribution after selection
The three modes of natural selection compared. Dashed curves show the original phenotypic distribution; solid colored curves show the distribution after selection. Directional selection shifts the mean, stabilizing selection narrows the variance, and disruptive selection creates a bimodal distribution.
ModeEffect on MeanEffect on VarianceFavored Phenotype(s)
DirectionalShifts toward one extremeMay decrease slightlyOne extreme
StabilizingStays approximately the sameDecreases (narrows)Intermediate
DisruptiveMay stay the same or splitIncreases (widens/bimodal)Both extremes

Summary of the three modes of natural selection and their effects on the phenotypic distribution

SECTION 6

Worked Example: Hardy-Weinberg & Selection

Consider a population of wildflowers in which petal color is determined by a single gene with two alleles: R (red, dominant) and r (white, recessive). In a sample of 500 individuals, 80 have white petals. A researcher wants to determine allele frequencies and assess whether the population might be experiencing natural selection.

Worked example

  1. 1

    Step 1 — Identify the recessive phenotype frequency

    White-flowered individuals are homozygous recessive (rr). The frequency of the rr genotype is q² = 80/500 = 0.16.
    q² = 0.16
  2. 2

    Step 2 — Calculate q (frequency of recessive allele)

    Taking the square root of q²: q = √0.16 = 0.4. Thus, the recessive allele (r) has a frequency of 0.4 in this population.
    q = 0.4
  3. 3

    Step 3 — Calculate p (frequency of dominant allele)

    Since p + q = 1: p = 1 − 0.4 = 0.6. The dominant allele (R) has a frequency of 0.6.
    p = 0.6
  4. 4

    Step 4 — Predict expected genotype frequencies under Hardy-Weinberg

    Expected: RR = p² = 0.36 (180 individuals); Rr = 2pq = 0.48 (240 individuals); rr = q² = 0.16 (80 individuals). Total = 500.
    Expected: RR = 180, Rr = 240, rr = 80
  5. 5

    Step 5 — Compare observed vs. expected to evaluate selection

    Suppose the researcher observes: RR = 200, Rr = 220, rr = 80. The excess of RR and deficit of Rr relative to Hardy-Weinberg expectations could suggest non-random mating or selection favoring homozygous dominant individuals. A chi-square goodness-of-fit test would be used to determine whether the deviation is statistically significant. If the population is confirmed to deviate from Hardy-Weinberg equilibrium and other factors (migration, genetic drift, mutation, non-random mating) are controlled, natural selection is the likely cause.
    Deviation from Hardy-Weinberg → possible evidence of natural selection

SECTION 7

Evidence for Natural Selection & Common Misconceptions

The evidence for natural selection spans molecular biology, paleontology, biogeography, and direct experimental observation. Equally important for the AP exam is understanding what natural selection does not do. A common exam strategy is to present misconceptions as answer choices, so recognizing and correcting them is as valuable as knowing the correct mechanism.

MisconceptionCorrection
Organisms evolve on purpose or by trying to adaptNatural selection is not goal-directed. Variation arises randomly; the environment filters it non-randomly.
Individual organisms evolve during their lifetimesIndividuals do not evolve. Populations evolve as allele frequencies change across generations.
Natural selection produces perfect organismsSelection works on existing variation and is constrained by trade-offs, historical contingency, and the availability of genetic variation.
Evolution means "survival of the fittest" (strongest)Fitness in biology = reproductive success, not physical strength. The "fittest" organism is the one that leaves the most viable offspring.
All evolution is due to natural selectionGenetic drift, gene flow, mutation, and non-random mating also cause evolution. Natural selection is the only mechanism that is adaptive.

Common misconceptions about natural selection and their corrections
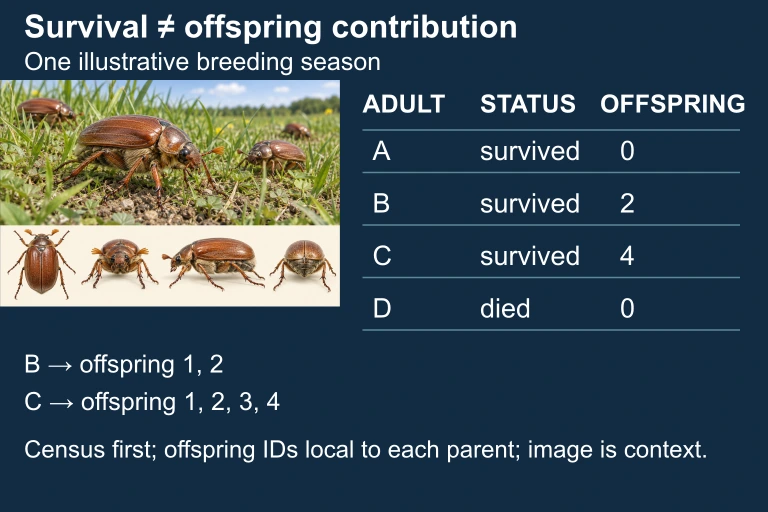
Beetle context alongside an illustrative table of survival and offspring counts for four adults.One illustrative breeding-season ledger separates survival from offspring contribution. The beetle illustration and four-angle strip provide organism context only; they are not identified as synthetic adults A–D or used to infer their offspring.

SECTION 8

Natural Selection in a Broader Evolutionary Context

While natural selection is the central mechanism of adaptive evolution, it operates alongside several other evolutionary forces. Understanding how these forces interact—sometimes reinforcing and sometimes opposing natural selection—is essential for the AP Biology exam and for a sophisticated understanding of population genetics.

Evolutionary ForceMechanismAdaptive?Relationship to Natural Selection
Natural SelectionDifferential survival and reproduction based on phenotypeYes—
Genetic DriftRandom fluctuations in allele frequency, especially in small populationsNoCan oppose selection; more powerful in small populations where it may override weak selection
Gene FlowMovement of alleles between populations via migrationNoCan introduce maladaptive alleles or homogenize populations, counteracting local selection
MutationRandom changes in DNA sequenceNo (random)Provides the raw genetic variation upon which natural selection acts
Sexual SelectionDifferential mating success based on traits preferred by mates or used in competitionYesA subset of natural selection; may sometimes oppose survival-based selection (e.g., peacock tails)

How other evolutionary forces relate to natural selection

Looking forward, natural selection connects to several advanced topics you will encounter in AP Biology: speciation (when selection in different environments drives reproductive isolation), coevolution (reciprocal natural selection between interacting species), and kin selection (which extends fitness to include the reproductive success of genetic relatives, explaining altruistic behaviors). Each of these builds directly on the principles of variation, heritability, and differential fitness introduced in this lesson.

SECTION 9

Practice Problems

Question 1: CONCEPTUAL

A population of lizards lives on a volcanic island where the rocks are dark-colored. Lizards with darker skin coloration are less visible to predatory hawks. Over many generations, the population shifts toward predominantly dark-colored individuals. Which condition of natural selection is MOST directly illustrated by the hawks' predation on lighter lizards?
  • A. Overproduction of offspring
  • B. Heritable variation in skin coloration
  • C. Differential survival based on phenotype
  • D. Random mutation generating new alleles
Show answer (C)
C is correct. The hawks selectively remove lighter lizards, creating differential survival based on phenotype—the core engine of natural selection. Option A (overproduction) is a prerequisite condition but is not directly illustrated by the predation event itself. Option B (heritable variation) is also a necessary condition, but the question asks about the hawks' predation, which specifically demonstrates differential survival, not heritability. Option D is incorrect because mutation is a separate evolutionary force that generates variation; the hawks are selecting among existing variation, not causing new mutations.

Question 2: BASIC CALCULATION

In a population of 1,000 clover plants, 90 display the recessive phenotype of no cyanide production (genotype cc). The allele for cyanide production (C) is dominant. Assuming Hardy-Weinberg equilibrium, what is the frequency of heterozygous (Cc) individuals in the population?
  • A. 0.21
  • B. 0.42
  • C. 0.49
  • D. 0.70
Show answer (B)
B is correct. The frequency of the recessive phenotype (cc) is q² = 90/1000 = 0.09. Therefore q = √0.09 = 0.3, and p = 1 − 0.3 = 0.7. The heterozygote frequency is 2pq = 2 × 0.7 × 0.3 = 0.42. Option A (0.21) results from calculating pq without the coefficient of 2. Option C (0.49) is p², the frequency of homozygous dominant individuals. Option D (0.70) is p itself, the allele frequency, not a genotype frequency.

Question 3: INTERMEDIATE

A researcher studying a population of ground squirrels finds that individuals with intermediate body size have the highest survival rates, while both unusually large and unusually small individuals experience higher mortality. After several generations, phenotypic variance in body size decreases but the mean body size remains unchanged. Which type of selection best explains this pattern?
  • A. Directional selection favoring intermediate phenotypes
  • B. Disruptive selection eliminating intermediate phenotypes
  • C. Stabilizing selection reducing phenotypic variance
  • D. Sexual selection for average-sized mates
Show answer (C)
C is correct. Stabilizing selection favors intermediate phenotypes and selects against both extremes, reducing phenotypic variance while keeping the mean constant. Option A is wrong because directional selection shifts the mean toward one extreme, which is not observed here. Option B describes the opposite pattern—disruptive selection eliminates intermediates and favors extremes, which would increase variance. Option D, while potentially contributing to mating patterns, is not supported by the data presented, which describes differential survival rather than differential mating success.

Question 4: APPLIED

The widespread use of a particular herbicide on agricultural fields has led to an increase in herbicide-resistant weed populations over two decades. A student claims that the herbicide caused mutations for resistance in the weeds. Design a controlled experiment to test whether the herbicide directly induces resistance mutations or whether it selects for pre-existing resistant variants. Your experimental design should include: (a) A clearly stated hypothesis (b) Identification of independent, dependent, and controlled variables (c) A description of the experimental and control groups (d) A prediction of results if selection (not induced mutation) is the correct explanation
Show answer
Sample Response: (a) Hypothesis: Herbicide resistance alleles exist in weed populations at low frequencies prior to herbicide exposure; the herbicide selects for pre-existing resistant variants rather than inducing new resistance mutations. (b) Variables — Independent: application of herbicide (treated vs. untreated); Dependent: number and variance in frequency of herbicide-resistant survivors across replicate populations; Controlled: weed genotype source (single seed stock), soil composition, light, temperature, water, herbicide concentration and application method. (c) Experimental design: Grow 20 genetically identical replicate populations from a common seed stock under identical conditions without herbicide. After populations reach a standard size, apply the herbicide at a uniform concentration to all 20 replicates simultaneously. Count the number of surviving (resistant) individuals in each replicate. Maintain 20 additional untreated replicates as controls. (d) Prediction: If resistance results from selection on pre-existing variation (the correct explanation), the number of resistant survivors will vary widely among replicates — some replicates will have many survivors (those that happened to contain a resistant mutant that arose early and proliferated) and some will have very few or none (the Luria-Delbrück fluctuation test prediction). If the herbicide directly induced mutations, each replicate would yield approximately the same number of resistant individuals, producing low variance across replicates.

Question 5: CRITICAL THINKING

A research team studied beak depth in a population of Galápagos finches before and after a severe drought. During the drought, only hard, large seeds were available. The data are shown below: • Before drought (n = 751): Mean beak depth = 9.42 mm, SD = 0.91 mm • After drought survivors (n = 90): Mean beak depth = 10.14 mm, SD = 0.78 mm Using these data: (a) Identify the type of selection occurring and justify your answer using both the mean and standard deviation. (b) Explain why beak depth must be heritable for this selection event to produce an evolutionary response in the next generation. (c) Predict what would happen to the mean beak depth in the population if wet conditions returned and small, soft seeds became abundant again. Justify your prediction. (d) Explain why natural selection alone cannot increase genetic variation in a population, and identify one mechanism that can.
Show answer
Sample Response: (a) This is directional selection. The mean beak depth increased from 9.42 mm to 10.14 mm among survivors, indicating that finches with deeper beaks had a survival advantage during the drought when only large, hard seeds were available. The standard deviation decreased from 0.91 to 0.78, reflecting the disproportionate loss of small-beaked individuals from the lower tail of the distribution. The combination of a shifted mean and reduced variance is characteristic of directional selection. (b) Heritability is essential because natural selection can only produce an evolutionary response if the selected trait has a genetic basis. If beak depth variation were purely environmental (e.g., caused only by nutrition differences), then the surviving large-beaked parents would produce offspring with the original, pre-drought distribution of beak sizes. Only when beak depth is heritable will the offspring of survivors tend to have deeper beaks, producing a lasting change in the population's mean beak depth. Quantitatively, the evolutionary response R = h²S, where h² is heritability and S is the selection differential; if h² = 0, then R = 0. (c) If wet conditions returned and small, soft seeds became the primary food source, directional selection would reverse, now favoring finches with smaller, more dexterous beaks. Over subsequent generations, the mean beak depth would decrease. This prediction is supported by the Grants' long-term field data showing oscillating selection on Galápagos finch beak dimensions in response to climate fluctuations. Natural selection is not progressive — it tracks current environmental conditions. (d) Natural selection can only increase the frequency of advantageous alleles and decrease the frequency of deleterious alleles that already exist in the population. It cannot create new alleles. Mutation is the ultimate source of new genetic variation, introducing novel alleles into the gene pool. Recombination during meiosis also generates new allelic combinations, increasing genotypic diversity. Without mutation continually supplying variation, natural selection would eventually exhaust the available variation and further adaptation would halt.

Varsity Tutors • AP Biology • Introduction to Natural Selection