
SECTION 1
Historical Context & Motivation
The idea that species change over time did not emerge from a single experiment but rather from centuries of observations across geology, anatomy, and natural history. Before the nineteenth century, the prevailing view in Western science was fixity of species—the notion that each species was independently created and remained unchanged. However, a growing body of fossil discoveries and biogeographic observations made this position increasingly difficult to defend. Naturalists noticed that organisms in neighboring regions shared striking anatomical similarities while differing in superficial traits adapted to local conditions. These patterns demanded a unifying explanation, one that could account for both the diversity and the underlying unity of life.
1809 • Lamarck's Inheritance of Acquired Characteristics
1831–1836 • Darwin's Voyage on HMS Beagle
1858 • Wallace–Darwin Joint Presentation
1859 • On the Origin of Species Published
1953–Present • Molecular Biology Revolution
The fundamental question Darwin confronted—and that modern evolutionary biology continues to refine—is this: What evidence demonstrates that the vast diversity of life arose through modification from shared ancestors rather than through independent origins? The strength of evolutionary theory lies in the convergence of independent lines of evidence—fossils, anatomy, molecular biology, biogeography, and direct observation—each pointing to the same conclusion.
SECTION 2
Core Lines of Evidence
Biologists identify several independent categories of evidence that support the theory of evolution by natural selection. Each line of evidence is compelling on its own, but their convergence toward the same phylogenetic relationships provides overwhelming support for common ancestry. AP Biology emphasizes five principal categories, each of which connects observations at different scales—from molecular sequences to continental distributions—into a coherent explanatory framework.
Fossil Record
Comparative Anatomy
Molecular Biology
Biogeography
Direct Observation
KEY TAKEAWAY
SECTION 3
Homologous Structures — Visual Comparison
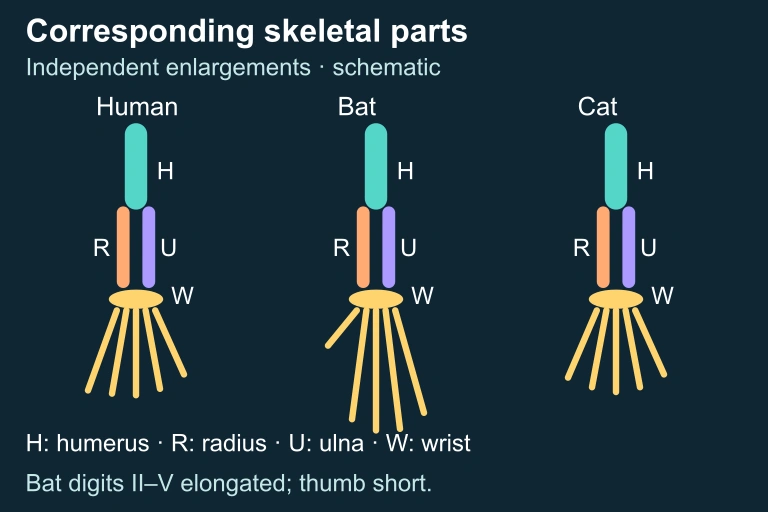
One of the most visually compelling lines of evidence for common ancestry comes from homologous structures—anatomical features in different species that share a common developmental origin and structural plan but have been modified for different functions. The vertebrate forelimb provides the classic example: the same set of bones (humerus, radius, ulna, carpals, metacarpals, and phalanges) appears in the arm of a human, the wing of a bat, the flipper of a whale, and the front leg of a cat. The diagram below illustrates how a single ancestral bone pattern has been reshaped by natural selection to serve locomotion, flight, swimming, and manipulation.
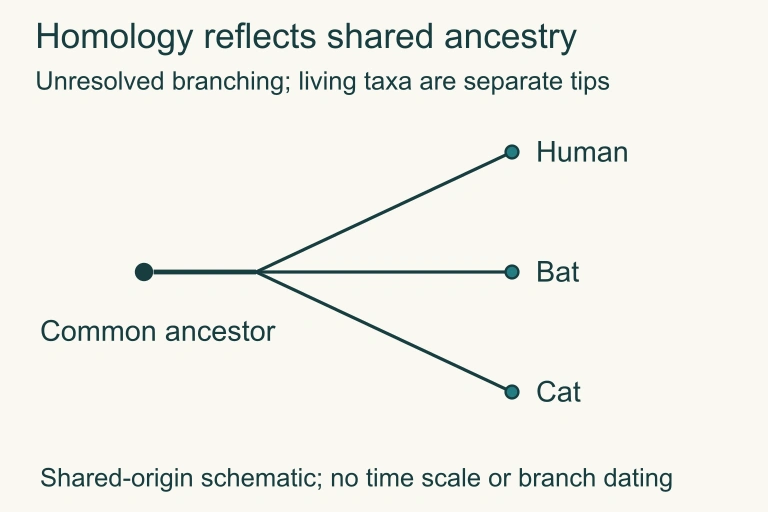
The critical insight is that these structures are homologous, not merely analogous. Analogous structures (such as the wing of a bird and the wing of an insect) serve similar functions but arise from entirely different developmental pathways—they are products of convergent evolution rather than shared ancestry. In contrast, homologous structures share the same embryonic tissue origin and underlying genetic program, which is precisely the pattern predicted if these species diverged from a common ancestor whose forelimb blueprint was inherited and subsequently modified.
 Corresponding skeletal parts
 Shared origin schematic
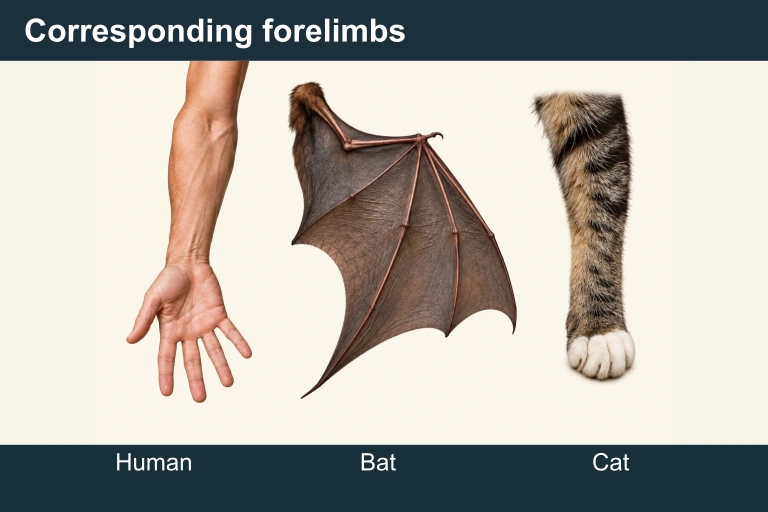 These independently enlarged forelimb topology schematics identify corresponding humerus, radius, ulna, wrist and five digits. They compare homology rather than exact bone shapes or proportions, and do not make living species ancestors of one another.
AP Exam Tip
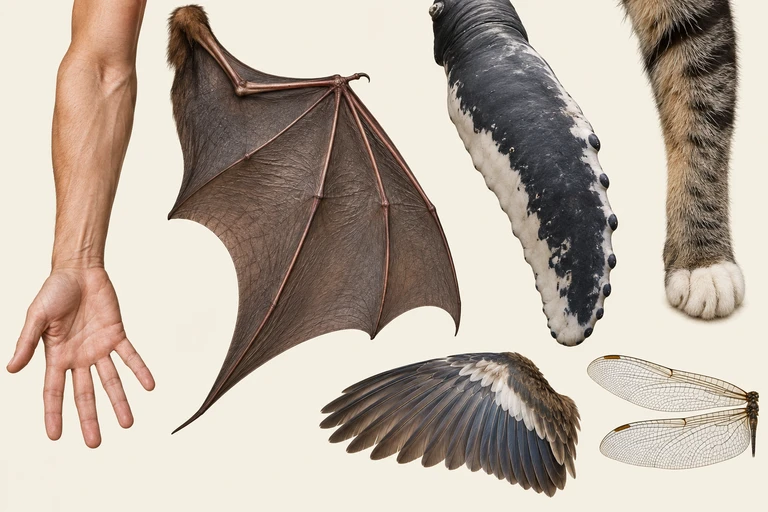 Corresponding forelimb bones reflect shared ancestry despite different functions. Bird and bat forelimb bones are homologous, while bird and insect flight surfaces are analogous.
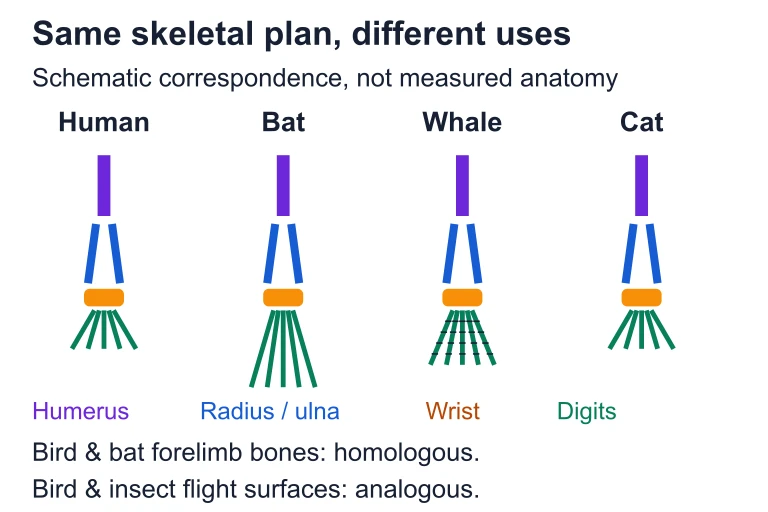 Corresponding forelimb bones reflect shared ancestry despite different functions. Bird and bat forelimb bones are homologous, while bird and insect flight surfaces are analogous.
SECTION 4
Molecular Evidence — How DNA Reveals Ancestry
Perhaps the most powerful modern evidence for evolution comes from molecular biology. All known life on Earth uses DNA as its hereditary molecule, employs the same genetic code to translate nucleotide triplets into amino acids, and relies on fundamentally conserved metabolic pathways such as glycolysis. These universal features are most parsimoniously explained by inheritance from a common ancestor. When scientists compare DNA or protein sequences across species, the degree of similarity correlates with the recency of shared ancestry inferred from anatomical and fossil data—an independent confirmation that strengthens both lines of evidence.
Molecular Clocks
A molecular clock uses the rate at which mutations accumulate in a lineage to estimate divergence times. If mutations in a particular gene or pseudogene accumulate at a roughly constant rate, then the number of nucleotide differences between two species is proportional to the time since they last shared a common ancestor. While the clock rate must be calibrated against fossil-derived dates and can vary among genes and lineages, molecular clocks have proven remarkably useful for dating evolutionary splits that left no fossil record.
MOLECULAR CLOCK RELATIONSHIP
Where D = number of nucleotide differences per site between two species, μ = mutation rate per site per unit time, and t = time since divergence. The factor of 2 accounts for mutations accumulating independently in both lineages since the split.
Cytochrome c and Conserved Genes
Cytochrome c is a small protein essential to the electron transport chain in aerobic organisms. Because its function is critical, its amino acid sequence is highly conserved across vast evolutionary distances. Humans and chimpanzees share 100% of their cytochrome c amino acid sequence, while humans and rhesus monkeys differ by a single amino acid. The number of differences increases with evolutionary distance: humans and dogs differ by about 11 residues, while humans and yeast differ by approximately 44 out of 104 total amino acids. This graded pattern of similarity mirrors phylogenetic trees built from anatomical and fossil data, providing striking independent corroboration of evolutionary relationships.
Pseudogenes and Shared Errors
Among the most convincing molecular evidence are shared pseudogenes—genes that have been inactivated by the same mutation in multiple species. For example, most primates (including humans) carry a nonfunctional copy of the gene for L-gulonolactone oxidase, an enzyme required for vitamin C synthesis. The identical frameshift mutation appears in the same location in humans, chimpanzees, and gorillas. The probability of the same disabling mutation arising independently at the same nucleotide position in unrelated lineages is vanishingly small, making shared pseudogenes powerful evidence for common descent.
SECTION 5
Fossil Record & Biogeographic Evidence
The Fossil Record
The fossil record provides a chronological archive of life's history. Radiometric dating and stratigraphy allow scientists to assign ages to fossils, revealing a clear pattern: simpler organisms appear in older strata, and more complex or derived forms appear in younger layers. Crucially, transitional fossils document intermediate stages between major groups. Tiktaalik (≈375 million years ago) shows features intermediate between lobe-finned fishes and early tetrapods, with a flat skull, a mobile neck, and fin bones resembling a wrist. Archaeopteryx bridges non-avian dinosaurs and modern birds with feathered wings, teeth, and a bony tail. Each transitional form appears in strata at the geologic time predicted by phylogenetic analysis, confirming the evolutionary sequence.
Biogeographic Evidence
The geographic distribution of species provides another independent line of support. Biogeography reveals that species on oceanic islands typically resemble those on the nearest mainland rather than species in similar habitats on distant continents. Darwin's finches in the Galápagos are more closely related to South American finches than to African finches occupying similar ecological niches. Likewise, marsupials dominate Australia because the continent was isolated by plate tectonics before placental mammals could colonize it, preserving a radiation of marsupial species filling niches occupied by placentals elsewhere. These patterns make sense only if species arise from local ancestors and then diversify—a prediction of evolution that the competing hypothesis of independent creation does not explain.
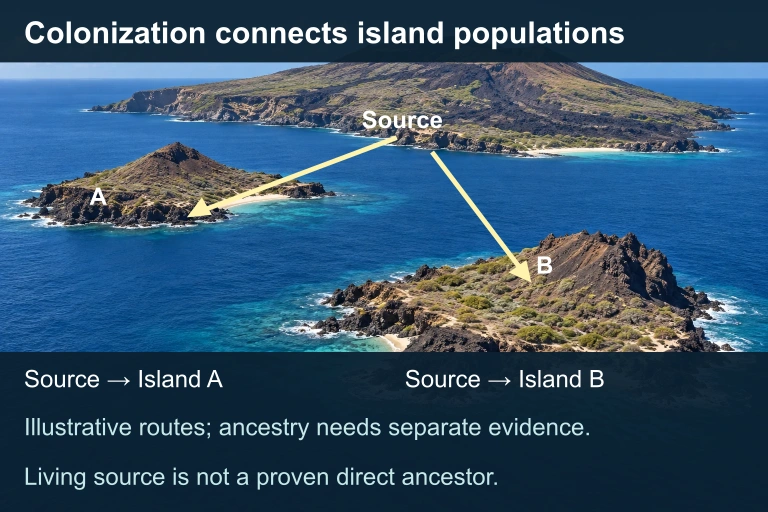 Illustrative source-to-island routes are separate from ancestry evidence; the living source is not a proven direct ancestor.
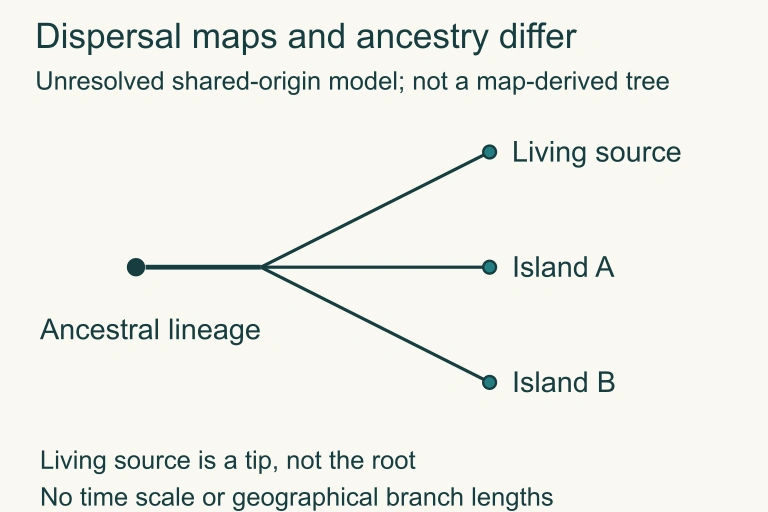 Exact schematic
 Geographic proximity and similar environments provide different kinds of evidence. Test inferred dispersal histories and ancestry with independent genetic and anatomical comparisons.
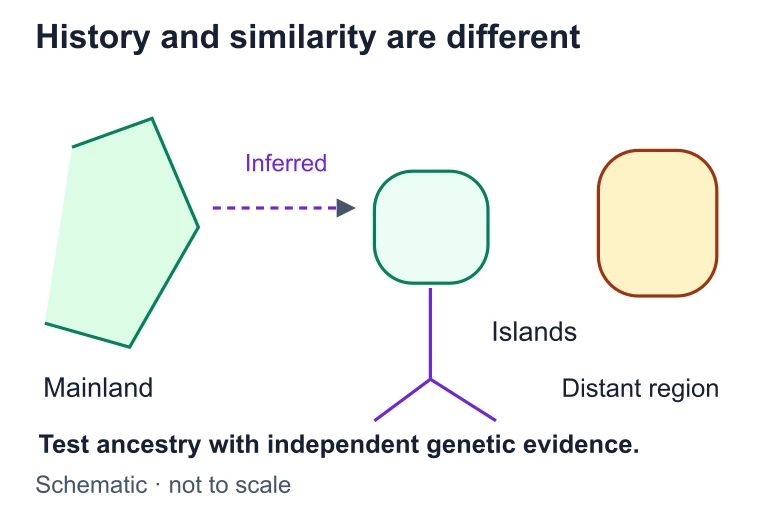 Geographic proximity and similar environments provide different kinds of evidence. Test inferred dispersal histories and ancestry with independent genetic and anatomical comparisons.
SECTION 6
Worked Example — Analyzing Cytochrome c Data
Suppose you are given the number of amino acid differences in cytochrome c between several species and asked to construct a relative phylogeny and estimate divergence times. Below is a step-by-step approach to interpreting such molecular data.
Constructing a Relative Phylogeny from Cytochrome c Data
- 1
Step 1 — Organize the Data
You are told that human cytochrome c differs from chimpanzee by 0 amino acids, from dog by 11, from rattlesnake by 14, from tuna by 21, and from yeast by 44. Arrange these differences in a distance matrix. Species with fewer differences are more closely related. - 2
Step 2 — Identify Closest Pairs
The smallest difference (0) is between human and chimpanzee—they are the most closely related pair. The next closest is dog (11 differences from human), followed by rattlesnake (14), tuna (21), and yeast (44). This ordering reflects the expected vertebrate phylogeny.Human–Chimp (0) < Dog (11) < Rattlesnake (14) < Tuna (21) < Yeast (44) - 3
Step 3 — Construct the Tree
Start by grouping the closest pair (human + chimp), then sequentially add each next-closest species as an outgroup. Dog branches off after the human-chimp split; rattlesnake branches earlier; tuna earlier still; and yeast is the most distant outgroup. The resulting tree matches the accepted phylogeny derived from fossils and anatomy. - 4
Step 4 — Estimate Divergence Time
Using the molecular clock equation D = 2μt and a calibration point (e.g., human–dog divergence at ≈80 MYA with 11 differences out of 104 residues), you can estimate μ. The per-residue divergence D = 11/104 ≈ 0.106, so μ ≈ 0.106 / (2 × 80 × 10⁶) ≈ 6.6 × 10⁻¹⁰ substitutions per site per year. This rate can then be applied to other pairs to estimate their divergence times.μ ≈ 6.6 × 10⁻¹⁰ substitutions/site/year - 5
Step 5 — Interpret the Results
The molecular phylogeny corroborates the anatomical and fossil-based phylogeny. This concordance of independent evidence strengthens the conclusion of common ancestry. Note that molecular clocks should be interpreted cautiously—mutation rates vary among lineages and genes—but the relative branching order is highly reliable.Molecular and morphological phylogenies converge → strong evidence for common descent
SECTION 7
Strengths & Limitations of Each Line of Evidence
While every line of evidence supports evolutionary theory, each has characteristic strengths and limitations. Understanding these nuances is important for evaluating scientific claims on the AP exam and for appreciating how multiple evidence types complement each other.
| Evidence Type | Strengths | Limitations |
|---|---|---|
| Fossil Record | Direct chronological evidence of morphological change; transitional fossils fill predicted gaps; radiometric dating provides absolute ages | Incomplete—fossilization is rare and biased toward hard-bodied marine organisms; soft tissue rarely preserved; gaps may persist for poorly fossilizing lineages |
| Comparative Anatomy | Visually intuitive; distinguishes homology from analogy; vestigial structures demonstrate loss of ancestral function | Convergent evolution can produce misleading similarities; requires expert judgment to distinguish homology from analogy in ambiguous cases |
| Molecular Biology | Quantitative and objective; applicable to all organisms with DNA; molecular clocks estimate divergence times; shared pseudogenes are statistically powerful | Clock rates vary across genes and lineages; horizontal gene transfer can obscure prokaryotic phylogenies; requires calibration against fossil dates |
| Biogeography | Explains global distribution patterns; integrates geology (plate tectonics) with biology; predicts island endemism | Dispersal events can obscure patterns; human-mediated introductions complicate modern distributions |
| Direct Observation | Demonstrates evolution occurring in real time; experimentally controlled in lab populations; directly tests natural selection | Limited to microevolutionary changes observable within human timescales; critics (incorrectly) argue it does not demonstrate macroevolution |
Strengths and limitations of the five major lines of evidence for evolution
KEY TAKEAWAY
SECTION 8
Connecting to Broader Evolutionary Theory
The evidence of evolution does not stand in isolation—it connects directly to the mechanisms of evolution covered elsewhere in AP Biology: natural selection, genetic drift, gene flow, and mutation. Understanding the evidence prepares you to interpret phylogenetic trees, analyze Hardy-Weinberg equilibrium departures as evidence of ongoing evolution, and evaluate cladograms constructed from morphological or molecular data.
| Concept | Evidence of Evolution Connection | Advanced Extension |
|---|---|---|
| Natural Selection | Directly observed in antibiotic resistance, pesticide resistance, and Darwin's finch beak size shifts | Population genetics quantifies selection coefficients; fitness landscapes model adaptive evolution |
| Genetic Drift | Neutral molecular divergence underpins molecular clocks; pseudogene drift supports phylogeny | Neutral theory (Kimura) distinguishes adaptive from stochastic sequence change |
| Speciation | Biogeographic evidence shows allopatric and sympatric speciation patterns; island radiations illustrate adaptive radiation | Reproductive isolation mechanisms; polyploidy in plants as an example of instant speciation |
| Phylogenetics | Comparative anatomy and molecular sequences are the raw data for tree construction; parsimony and maximum likelihood methods | Bayesian phylogenetics; coalescent theory; horizontal gene transfer in prokaryotes |
How evidence of evolution connects to broader topics in evolutionary biology
As you advance in biology, the evidence for evolution becomes the foundation for understanding virtually every aspect of the discipline—from medicine (why pathogens evolve drug resistance) to conservation biology (using phylogenies to prioritize species for protection) to genomics (using comparative sequence analysis to identify functional DNA regions). The AP Biology framework explicitly expects you to connect evidence of evolution to these broader themes, especially in free-response questions that require you to integrate knowledge across units.
SECTION 9
Practice Problems
Question 1: CONCEPTUAL
- A. Homologous structures resulting from shared ancestry
- B. Analogous structures resulting from convergent evolution
- C. Vestigial structures that have lost their original function
- D. Homologous structures resulting from convergent evolution
Show answer (B)
Question 2: BASIC CALCULATION
- A. 8 million years
- B. 40 million years
- C. 80 million years
- D. 160 million years
Show answer (B)
Question 3: INTERMEDIATE
- A. The same mutation arose independently in both lineages by chance, reflecting convergent molecular evolution.
- B. A viral insertion inactivated the gene in both species independently after divergence.
- C. The mutation occurred once in a common ancestor and was inherited by both descendant lineages.
- D. Natural selection independently favored the loss of this gene in both species due to similar dietary pressures.
Show answer (C)
Question 4: APPLIED
4 ptsShow answer
Question 5: CRITICAL THINKING
4 ptsShow answer
SUMMARY
Summary — Evidence of Evolution
Summary
The theory of evolution by natural selection is supported by five converging lines of evidence. The fossil record documents the chronological succession of life forms and provides transitional fossils linking major groups. Comparative anatomy reveals homologous structures (same developmental origin, different function) and vestigial structures (reduced remnants of ancestral organs), both of which point to common descent. Molecular biology provides the most quantitative evidence: shared DNA sequences, the universal genetic code, molecular clocks (D = 2μt), and shared pseudogenes all independently confirm phylogenetic relationships.
Biogeography explains why species distributions reflect evolutionary history and geological events like continental drift, while direct observation of antibiotic resistance, pesticide resistance, and beak size shifts demonstrates natural selection acting on heritable variation in real time. The power of the evolutionary framework lies in consilience—the independent convergence of all five lines of evidence on the same phylogenetic relationships, making common descent one of the most robustly supported theories in all of science. Be prepared to distinguish homologous structures from analogous structures (convergent evolution), to apply the molecular clock equation, and to evaluate experimental evidence for natural selection on the AP exam.