

SECTION 1
Historical Context & Motivation
Long before the molecular mechanisms of catalysis were understood, scientists recognized that certain biological substances could accelerate chemical reactions that would otherwise proceed imperceptibly slowly under physiological conditions. The study of enzymes — a term coined from the Greek en zyme, meaning 'in leaven' — arose from observations of fermentation processes that had been exploited for millennia in brewing, baking, and cheese-making. The intellectual journey from these practical observations to a rigorous biochemical framework illustrates how chemistry and biology converge in the discipline we now call enzymology.
1833 • Payen & Persoz — Diastase
1897 • Buchner — Cell-Free Fermentation
1913 • Michaelis & Menten — Kinetic Model
1926 • Sumner — Enzyme Crystallization
1965 • Monod, Wyman & Changeux — Allosteric Regulation
The central question that drove enzymology forward was deceptively simple: how do living systems accelerate specific reactions by factors of 106 to 1017 under mild conditions of temperature and pH, while industrial catalysts require extreme heat and pressure? Answering this question required understanding how the three-dimensional structure of proteins creates microenvironments that stabilize transition states and lower the energy barrier — the activation energy — of biochemical reactions.
SECTION 2
Core Principles of Enzyme Function
Enzymes are overwhelmingly proteins (with notable exceptions such as catalytic RNA molecules called ribozymes) whose catalytic power arises from their precise three-dimensional folding. Each enzyme possesses a region called the active site — a cleft or pocket formed by specific amino acid residues — where the substrate binds and the chemical transformation occurs. Understanding enzyme function requires grasping several interconnected principles that appear repeatedly on the AP Biology exam.
Activation Energy (Eₐ) Lowering
Substrate Specificity
Catalytic Cycle & Reusability
Environmental Sensitivity
Regulation
KEY TAKEAWAY
SECTION 3
Energy Diagram — Catalyzed vs. Uncatalyzed Reactions
The energy diagram above is one of the most frequently tested visuals on the AP Biology exam. Notice that both the catalyzed and uncatalyzed pathways begin at the same reactant energy level and end at the same product energy level — the enzyme does not alter the thermodynamics of the reaction. What changes is the height of the energy barrier. By providing an alternative reaction pathway — typically involving temporary covalent bonds, charge stabilization, or precise orientation of substrates — the enzyme reduces Eₐ and thereby increases the fraction of molecules with sufficient kinetic energy to undergo the transition at any given temperature. This is why enzymes can produce dramatic rate enhancements without requiring the high temperatures that would denature cellular components.
AP Exam Tip
SECTION 4
How Enzymes Work — Mechanism & Kinetics
The Lock-and-Key vs. Induced-Fit Models
Emil Fischer's 1894 lock-and-key model proposed that the enzyme's active site is a rigid structure perfectly complementary to the substrate, much as a key fits only its matching lock. Although this model introduced the critical concept of specificity, X-ray crystallography later revealed that proteins are dynamic rather than rigid. Daniel Koshland's induced-fit model (1958) refined Fischer's idea by proposing that substrate binding induces conformational changes in the enzyme, optimizing the fit and positioning catalytic residues for the reaction. The induced-fit model better accounts for observed phenomena such as cooperativity, allosteric effects, and the catalysis of chemically diverse substrates by related enzyme families.
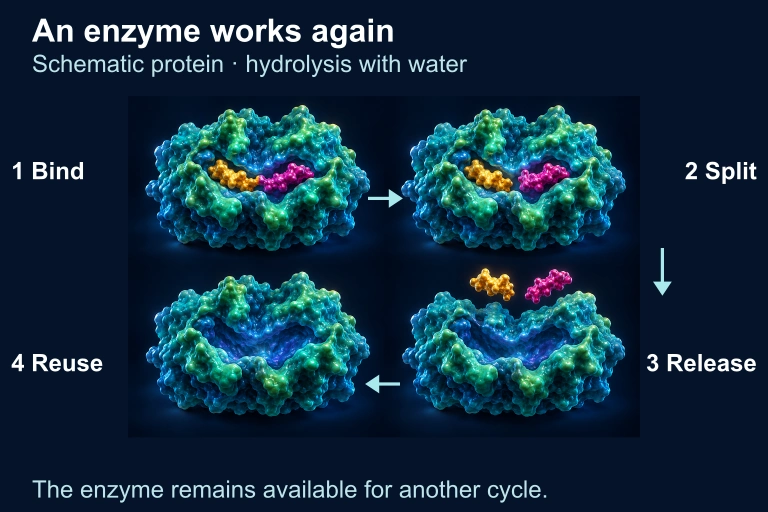 An enzyme binds a peptide, helps split it using water, and releases the products. The enzyme remains available for another cycle. The protein shape is illustrative rather than a validated molecular structure.
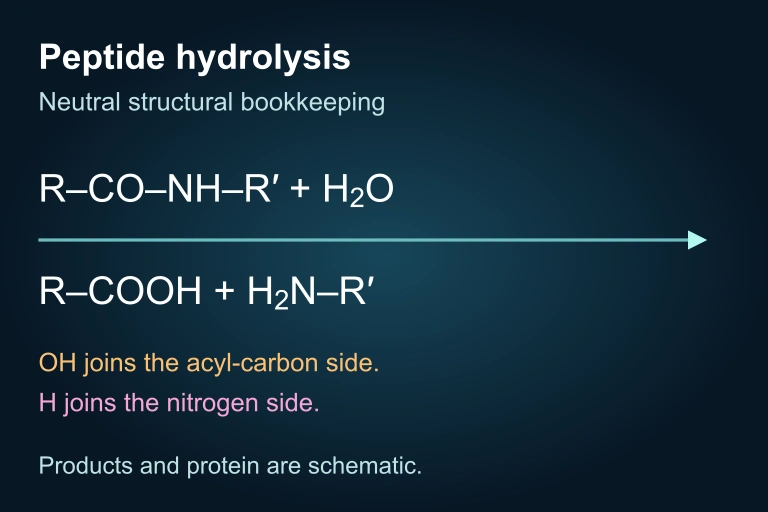 Peptide chemistry
Michaelis–Menten Kinetics
The quantitative relationship between substrate concentration [S] and reaction velocity (v) was formalized by Michaelis and Menten in 1913. While the AP Biology exam does not require you to derive the equation, understanding its components and the shape of the resulting curve is essential for interpreting experimental data.
MICHAELIS–MENTEN EQUATION
v = initial reaction velocity; Vmax = maximum velocity when all enzyme active sites are saturated; [S] = substrate concentration; Km = Michaelis constant (the [S] at which v = ½ Vmax). A low Km indicates high substrate affinity.
When [S] is much less than Km, the equation simplifies to v ≈ (Vmax/Km) × [S], and the reaction rate increases nearly linearly with substrate. When [S] greatly exceeds Km, v approaches Vmax asymptotically — the enzyme is saturated and adding more substrate has little effect. This hyperbolic saturation curve is a hallmark of Michaelis–Menten enzymes and appears frequently on the AP exam in data-analysis contexts.
ENZYME–SUBSTRATE EQUILIBRIUM
E = enzyme; S = substrate; ES = enzyme–substrate complex; P = product. The reversible first step reflects binding; the irreversible second step represents catalysis and product release.
SECTION 5
Enzyme Regulation & Inhibition
Cells do not simply let enzymes run at full speed; instead, sophisticated regulatory mechanisms fine-tune metabolic flux to match changing conditions. The AP Biology curriculum emphasizes four major modes of enzyme regulation: competitive inhibition, noncompetitive (allosteric) inhibition, feedback (end-product) inhibition, and cooperativity. Understanding the structural basis and kinetic signatures of each is critical for both multiple-choice and free-response success.
| Feature | Competitive Inhibitor | Noncompetitive Inhibitor |
|---|---|---|
| Binding site | Active site (same as substrate) | Allosteric site (different from active site) |
| Resembles substrate? | Yes — structural analog | No — different shape |
| Effect on Vmax | Unchanged (can be overcome by excess substrate) | Decreased (cannot be overcome by excess substrate) |
| Effect on Km | Increased (apparent lower affinity) | Unchanged |
| Overcome by ↑[S]? | Yes | No |
Kinetic effects of competitive vs. noncompetitive inhibition
SECTION 6
Worked Example — Interpreting Enzyme Kinetics Data
The following example mirrors the type of data-analysis question you may encounter on the AP Biology exam. You are given a table of initial reaction velocities at various substrate concentrations for an enzyme tested alone and in the presence of an unknown inhibitor. Your task is to determine the type of inhibition.
Identifying Inhibition Type from Kinetic Data
- 1
Step 1 — Examine the Data
Without inhibitor: at high [S] (10 mM), v approaches 100 µmol/min, so Vmax ≈ 100 µmol/min. The [S] at which v = 50 µmol/min (half Vmax) is approximately 2 mM, so Km ≈ 2 mM.Km ≈ 2 mM; Vmax ≈ 100 µmol/min - 2
Step 2 — Examine the Inhibited Data
With inhibitor: at high [S] (10 mM), v now only reaches about 50 µmol/min, suggesting Vmax has decreased. The [S] at which v = 25 µmol/min (half the new Vmax) is still approximately 2 mM, indicating Km has not changed.Vmax decreased; Km unchanged - 3
Step 3 — Compare to Inhibition Signatures
Competitive inhibition increases Km but leaves Vmax unchanged. Noncompetitive inhibition decreases Vmax but leaves Km unchanged. Our data show decreased Vmax with unchanged Km. - 4
Step 4 — State the Conclusion
Because Vmax decreased while Km remained constant, the unknown inhibitor is a noncompetitive inhibitor. It likely binds to an allosteric site, reducing the number of functional enzyme molecules without affecting substrate binding affinity.Noncompetitive inhibition confirmed
SECTION 7
Environmental Factors Affecting Enzyme Activity
Because enzymes rely on precise three-dimensional conformations, environmental conditions that disrupt protein folding profoundly affect catalytic rates. The AP Biology curriculum highlights temperature, pH, substrate concentration, and enzyme concentration as the major variables. Being able to predict and interpret the shape of enzyme activity curves under varying conditions is a commonly tested skill.
| Factor | Effect at Low Levels | Effect at Optimal Level | Effect at High Levels |
|---|---|---|---|
| Temperature | Slow molecular motion → low collision frequency → low reaction rate | Maximum kinetic energy within stable conformation → peak rate | Denaturation disrupts H-bonds, hydrophobic interactions → activity plummets |
| pH | Excess H⁺ protonates key residues → altered charge, shape | Ionization states of active-site residues favor catalysis | Excess OH⁻ deprotonates residues → denaturation at extremes |
| [Substrate] | Rate increases nearly linearly (first-order kinetics) | — | Saturation: all active sites occupied → rate plateaus at Vmax |
| [Enzyme] | Fewer catalytic sites available → lower overall rate | — | Rate increases proportionally (assuming excess substrate); no saturation effect |
How environmental factors influence enzyme activity
KEY TAKEAWAY
SECTION 8
Connections to Broader Biology
Enzymes do not function in isolation — they are embedded within complex metabolic networks, signaling cascades, and gene-regulation circuits. The AP Biology curriculum connects enzyme concepts to multiple Big Ideas, including the relationship between structure and function (Big Idea 1), the use of free energy to drive cellular processes (Big Idea 2), and the storage and transmission of genetic information (Big Idea 3). Understanding enzymes as a unifying theme strengthens your ability to make cross-topic connections on the exam.
| Enzyme Concept | Advanced Connection |
|---|---|
| Active site specificity (lock-and-key / induced fit) | Receptor–ligand binding in cell signaling; antibody–antigen interactions in immune response |
| Allosteric regulation & feedback inhibition | Metabolic pathway regulation in glycolysis (phosphofructokinase), cellular respiration, and photosynthesis |
| Denaturation | Protein misfolding diseases (prions, Alzheimer's); chaperone proteins that assist proper folding |
| Coenzymes & cofactors | Vitamins as coenzyme precursors (NAD⁺ from niacin, FAD from riboflavin); role in electron transport chain |
| Gene regulation of enzyme synthesis | Operons in prokaryotes (lac operon induced by lactose); transcription factor regulation in eukaryotes |
How enzyme principles connect to advanced biological topics
As you progress through the AP Biology curriculum, you will encounter enzymes repeatedly in seemingly different contexts — from DNA polymerase in replication to rubisco in carbon fixation to restriction enzymes in biotechnology. Recognizing that the same fundamental principles of substrate specificity, activation energy lowering, and regulation underpin all of these examples will allow you to transfer knowledge efficiently between units and construct more sophisticated free-response answers.
SECTION 9
Practice Problems
Question 1: CONCEPTUAL
- A. The enzyme increases the free energy of the products, making the reaction more exergonic.
- B. The enzyme decreases the activation energy without changing the free energy change (ΔG) of the reaction.
- C. The enzyme shifts the equilibrium toward the products, increasing the amount of Y at equilibrium.
- D. The enzyme provides energy to the reactants, allowing them to overcome the activation energy barrier.
Show answer (B)
Question 2: BASIC CALCULATION
- A. 50 µmol/min
- B. 100 µmol/min
- C. 150 µmol/min
- D. 200 µmol/min
Show answer (B)
Question 3: INTERMEDIATE
- A. Z is a noncompetitive inhibitor that binds to an allosteric site.
- B. Z is a competitive inhibitor that binds to the active site.
- C. Z is an irreversible inhibitor that covalently modifies the enzyme.
- D. Z is a cofactor that stabilizes the enzyme–substrate complex.
Show answer (B)
Question 4: APPLIED
4 ptsShow answer
Question 5: CRITICAL THINKING
4 ptsShow answer
SUMMARY
Enzymes — Summary Review
Summary
Enzymes are biological catalysts — predominantly proteins — that accelerate metabolic reactions by lowering the activation energy (Eₐ) without altering the overall free energy change (ΔG) of the reaction. Each enzyme possesses an active site with a specific shape, charge, and chemical environment that binds its substrate via the induced-fit model. The Michaelis–Menten equation (v = Vmax[S] / (Km + [S])) describes the hyperbolic relationship between substrate concentration and reaction velocity, where Km reflects substrate affinity and Vmax represents the maximum rate at enzyme saturation.
Enzyme activity is regulated by competitive inhibitors (which bind the active site and increase apparent Km) and noncompetitive inhibitors (which bind allosteric sites and decrease Vmax). Temperature and pH modulate activity by affecting protein conformation, with each enzyme exhibiting characteristic optima. Feedback inhibition enables self-regulating metabolic pathways, where the end product inhibits an earlier enzyme. These principles — specificity, catalytic efficiency, regulation, and environmental sensitivity — form a conceptual foundation that extends across virtually every topic in AP Biology, from cellular energetics to molecular genetics to ecology.