
SECTION 1
Historical Context & Motivation
Early geneticists assumed a straightforward relationship between genotype and phenotype: one gene, one trait, one outcome. Gregor Mendel's pea plants, grown under carefully controlled greenhouse conditions, seemed to confirm this deterministic view. However, as genetics moved from monastery gardens to field studies and hospital wards, researchers encountered puzzling cases where organisms with identical genotypes displayed markedly different phenotypes. The question of how the environment shapes the expression of genes has become one of the most important and nuanced themes in modern biology.
1909 • Johannsen Coins 'Genotype' and 'Phenotype'
1940s • Norm of Reaction Established
1942 • Waddington's Epigenetic Landscape
1990s–Present • Molecular Epigenetics
These discoveries reframed the central question of heredity: if the genotype does not rigidly dictate the phenotype, what determines which phenotype an organism actually displays? The answer lies in the interplay between genetic instructions and the environmental context in which those instructions are read—a theme that pervades ecology, medicine, agriculture, and evolutionary biology.
SECTION 2
Core Principles & Definitions
Understanding environmental effects on phenotype requires a firm grasp of several interconnected concepts. At its core, the relationship can be expressed simply: Phenotype = Genotype + Environment + (Genotype × Environment interaction). This equation captures the idea that genes set a range of possible outcomes, the environment selects from within that range, and the interaction between the two can produce effects that neither factor alone would predict.
Norm of Reaction
Phenotypic Plasticity
Multifactorial Traits
Epigenetics
SECTION 3
Visualizing the Norm of Reaction
The diagram above captures the essential insight of the norm of reaction: a genotype does not produce a single fixed phenotype but rather a range of phenotypes depending on environmental conditions. When the reaction norm is steep, the organism displays high phenotypic plasticity. When it is flat, the trait is said to be canalized—buffered against environmental variation. Notice that the two curves cross: at 15 °C, Genotype B produces a larger body size, but at 35 °C, Genotype A does. This crossing pattern means you cannot simply rank one genotype as 'better' without specifying the environment, which is the hallmark of a G × E interaction.
SECTION 4
Molecular Mechanisms of Environmental Influence
How does an environmental signal actually change what a gene does? The answer operates at multiple levels—from transcription factor activity to chromatin remodeling. Environmental cues such as temperature, nutrition, light, and chemical exposure feed into cellular signaling pathways that ultimately alter gene expression without modifying the underlying DNA sequence. The three most studied molecular mechanisms are DNA methylation, histone modification, and temperature-sensitive protein folding.
DNA Methylation
Methyl groups (–CH₃) added to cytosine bases in CpG islands typically silence gene transcription by preventing transcription factors from binding to promoter regions. Environmental factors such as diet (folate availability), toxins, and stress hormones can alter methylation patterns. In the classic Agouti mouse experiment, genetically identical mice displayed phenotypes ranging from obese and yellow to lean and brown depending on maternal dietary methyl donors—a striking demonstration that nutrition during development can redirect phenotypic expression through epigenetic marks.
Histone Modification
Histones can be acetylated, methylated, phosphorylated, or ubiquitinated at their N-terminal tails. Acetylation of histones generally loosens chromatin (euchromatin), making genes accessible for transcription, while deacetylation leads to tighter packing (heterochromatin) and gene silencing. Environmental stressors, including temperature extremes and caloric restriction, have been shown to shift the acetylation landscape, thereby altering the transcriptional profile of cells.
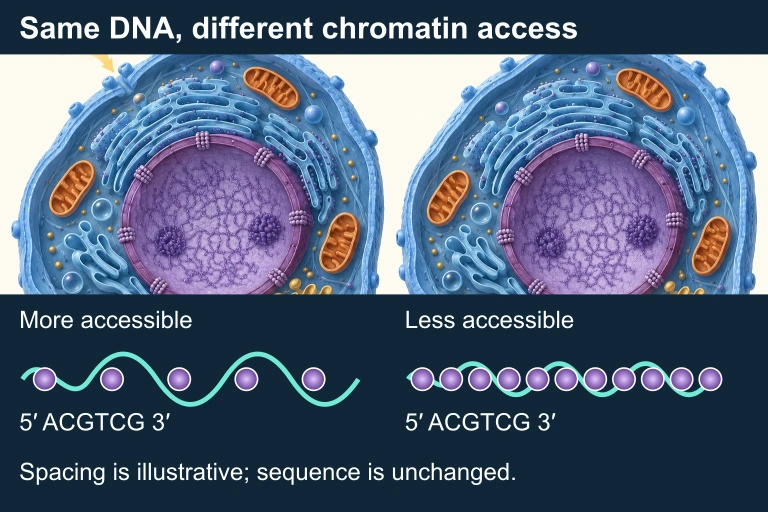 Chromatin accessibility can differ without changing the DNA sequence. The example is schematic and does not imply inheritance across generations.
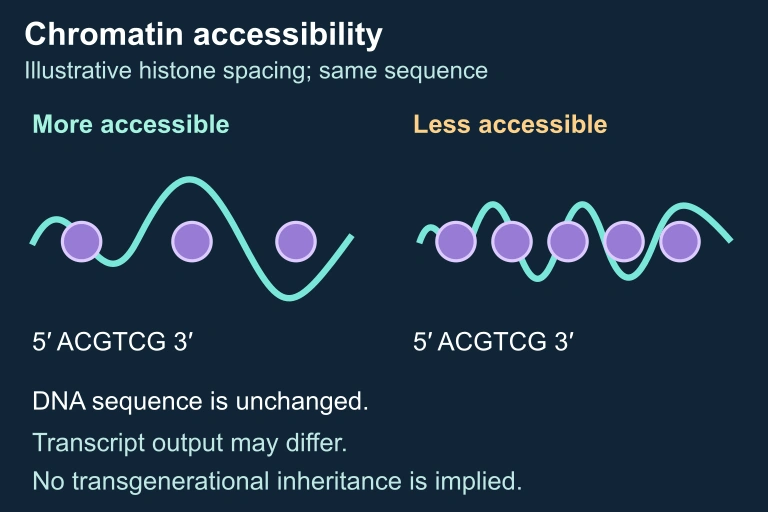 Exact schematic
Temperature-Sensitive Alleles & Proteins
Some proteins function only within a narrow temperature window. The Siamese cat coat-color pattern results from a temperature-sensitive allele of the tyrosinase gene (the cˢ allele). The enzyme is active only in cooler body regions (ears, nose, paws, tail), producing dark pigment there, while warmer regions remain pale. The genotype is uniform throughout the body, but the phenotype is patterned because the enzyme's conformation depends on local temperature.
SECTION 5
Classic Examples Across Kingdoms
Environmental effects on phenotype are not limited to a single taxon. From plants to reptiles to humans, organisms across the tree of life demonstrate how genotype and environment interact to produce observable traits.
| Organism | Trait | Environmental Factor | Mechanism |
|---|---|---|---|
| Hydrangea | Flower color | Soil pH | Aluminum ion availability alters pigment molecule conformation |
| Siamese cat | Coat color pattern | Body temperature | Temperature-sensitive tyrosinase allele; active only in cooler regions |
| Humans | Height | Nutrition | Adequate nutrition during development allows full expression of height-related polygenes |
| Crocodilians / some turtles | Sex | Incubation temperature | Temperature-dependent sex determination (TSD); aromatase activity varies with temperature |
| Daphnia (water flea) | Helmet/spine morphology | Predator chemical cues (kairomones) | Chemical signals activate defensive morphology genes during development |
Selected examples of environmental phenotype modification across taxa
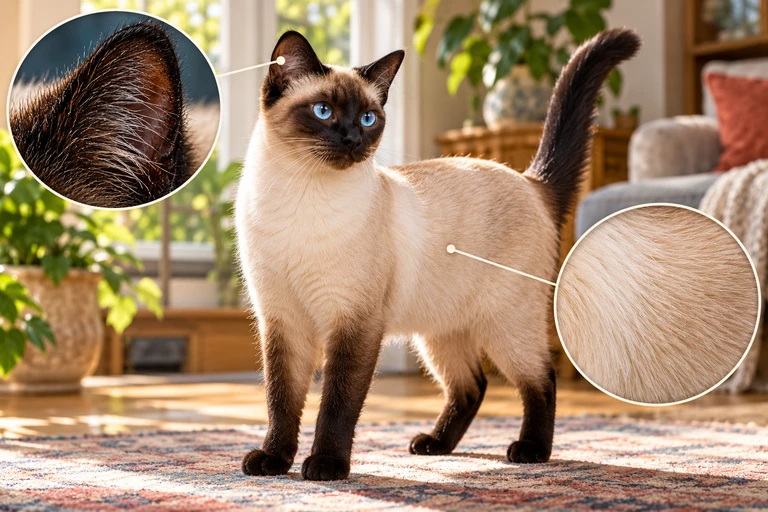 A temperature-sensitive tyrosinase allele can produce more melanin in cooler extremities and less in the warmer torso. Temperature changes enzyme activity while the DNA sequence remains the same.
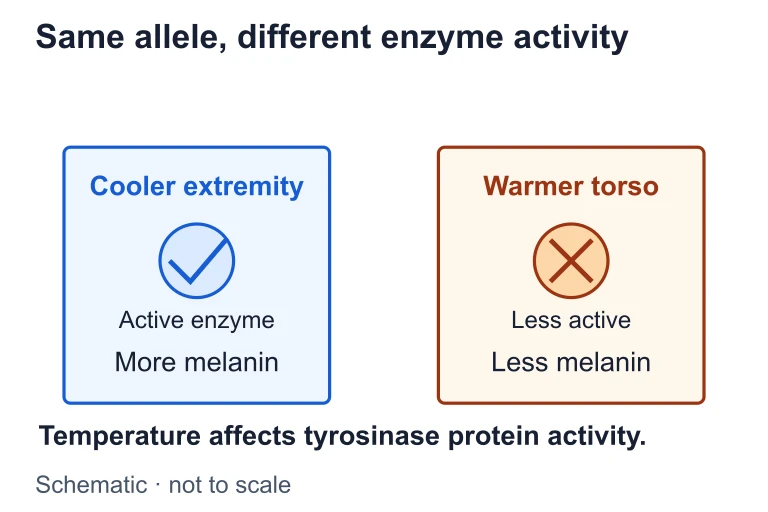 A temperature-sensitive tyrosinase allele can produce more melanin in cooler extremities and less in the warmer torso. Temperature changes enzyme activity while the DNA sequence remains the same.
 Compare independently replicated shaded and unshaded nests with matched depth and handling. Measure temperature through the sensitive incubation period and relate it to species-specific offspring sex ratios.
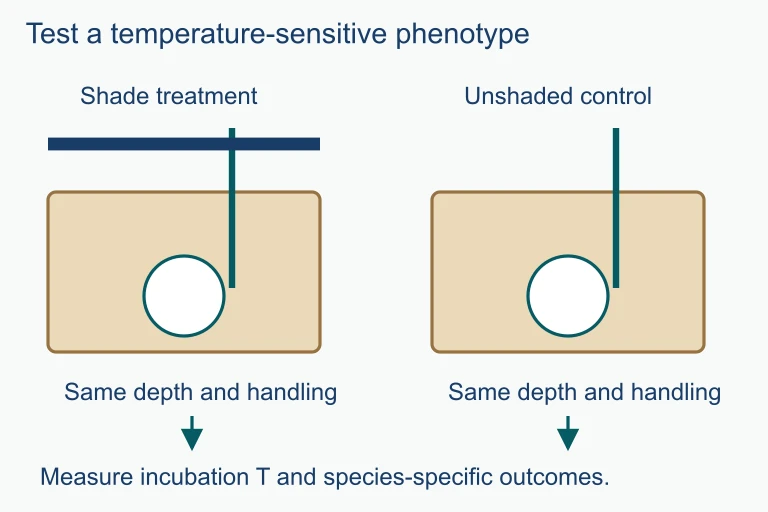 Compare independently replicated shaded and unshaded nests with matched depth and handling. Measure temperature through the sensitive incubation period and relate it to species-specific offspring sex ratios.
SECTION 6
Worked Example: Interpreting a Norm of Reaction Experiment
Suppose a researcher clones two genotypes of a plant species (Genotype X and Genotype Y) and grows replicates at three light intensities: low (200 μmol photons m⁻² s⁻¹), medium (600), and high (1000). She measures mean leaf area (cm²) after 8 weeks.
| Light Intensity | Genotype X leaf area (cm²) | Genotype Y leaf area (cm²) |
|---|---|---|
| Low (200) | 45 | 42 |
| Medium (600) | 30 | 38 |
| High (1000) | 15 | 35 |
Mean leaf area after 8 weeks at three light intensities
Worked example
- 1
Step 1 — Identify the Variables
The independent variable is light intensity (three levels). The dependent variable is mean leaf area. The genotype (X vs. Y) is the factor whose reaction norms we want to compare. Because the plants are clones, genetic variation within each genotype is eliminated. - 2
Step 2 — Assess Plasticity of Each Genotype
Genotype X leaf area decreases from 45 cm² to 15 cm², a range of 30 cm². Genotype Y decreases from 42 cm² to 35 cm², a range of only 7 cm². Therefore, Genotype X is far more plastic in its leaf area response to light.Genotype X range = 30 cm²; Genotype Y range = 7 cm² - 3
Step 3 — Check for G × E Interaction
At low light, Genotype X has slightly larger leaves than Y (45 vs. 42). At high light, Genotype Y has much larger leaves than X (35 vs. 15). The rank order of genotypes reverses across environments, which is definitive evidence of a G × E interaction.G × E interaction confirmed—rank reversal across environments - 4
Step 4 — Biological Interpretation
Genotype X displays a classic shade-avoidance response, producing large leaves in low light to maximize photon capture, but dramatically reducing leaf area under high light (possibly to reduce water loss and photodamage). Genotype Y is canalized for moderate-sized leaves regardless of light. Neither genotype is universally 'better'; the optimal genotype depends on the light environment.Adaptive interpretation: plasticity in Genotype X may be favored in variable light habitats
 After eight weeks at light intensities of 200, 600 and 1,000 µmol photons/m²/s, mean leaf areas are 45, 30 and 15 cm² for genotype X and 42, 38 and 35 cm² for genotype Y. Their nonparallel responses show genotype-by-environment interaction.
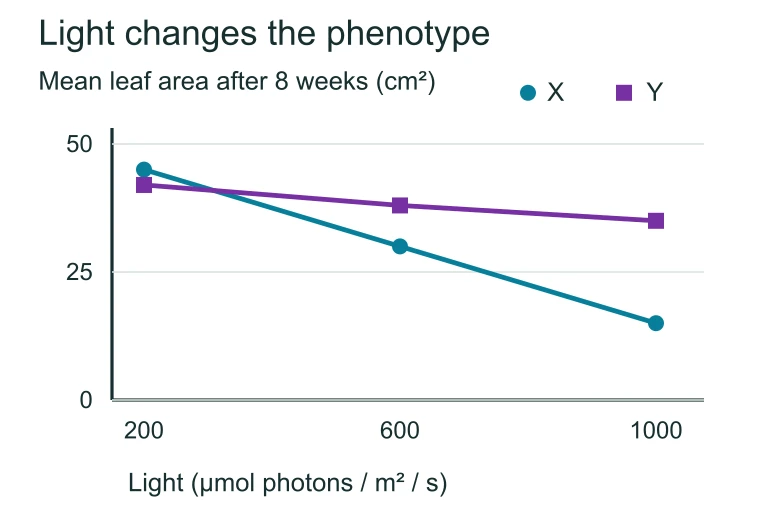 After eight weeks at light intensities of 200, 600 and 1,000 µmol photons/m²/s, mean leaf areas are 45, 30 and 15 cm² for genotype X and 42, 38 and 35 cm² for genotype Y. Their nonparallel responses show genotype-by-environment interaction.
SECTION 7
Plasticity, Canalization & Adaptation
Not all phenotypic plasticity is adaptive. Understanding the spectrum from highly plastic to strongly canalized traits—and recognizing when each strategy confers fitness benefits—is critical for AP Biology.
| Feature | High Plasticity | Canalization |
|---|---|---|
| Norm of reaction | Steep curve; wide phenotypic range | Flat curve; narrow phenotypic range |
| Environmental sensitivity | High—phenotype strongly shaped by environment | Low—phenotype buffered against environmental perturbation |
| Selective advantage | Variable or unpredictable environments | Stable environments where a single phenotype is optimal |
| Cost | Energetic cost of maintaining sensory/regulatory machinery | Reduced ability to acclimate to new conditions |
| Classic example | Daphnia helmet formation in response to predator cues | Vertebrate eye lens shape (highly conserved) |
Comparison of high plasticity vs. canalization
SECTION 8
Connecting to Evolution & Broader Biology
Environmental effects on phenotype connect directly to several other AP Biology themes: natural selection acts on phenotypes (not genotypes), so the environment shapes both the trait expression and the selective pressures acting on those traits. Additionally, epigenetic modifications raise the possibility that some environmentally induced phenotypic changes can be transmitted across generations—a concept that echoes Lamarckian ideas while operating through firmly Mendelian molecular machinery.
| Concept | Basic Understanding (This Lesson) | Advanced Extension |
|---|---|---|
| Gene expression regulation | Environment alters which genes are active (methylation, histone mods) | Signal transduction cascades link receptors to transcription factor activation (AP Bio Unit 4) |
| Natural selection | Selection acts on phenotype, which includes environmental component | Baldwin effect: plasticity may facilitate evolutionary change by allowing survival in novel environments |
| Twin studies | Monozygotic twins can differ due to environmental effects | Heritability estimates (h²) quantify the genetic vs. environmental contribution to trait variance in a population |
| Climate change | Temperature-dependent sex determination may skew sex ratios | Phenological mismatches: plasticity limits may be exceeded under rapid environmental change |
Connecting environmental effects on phenotype to broader AP Biology concepts
As you encounter later units on ecology and evolution, remember that the phenotype an organism presents to its environment is always the product of both its genetic endowment and the conditions in which it develops. This insight is foundational for understanding fitness, adaptation, and the ongoing response of populations to global environmental change.
SECTION 9
Practice Problems
Question 1: CONCEPTUAL
- A. A mutation occurred in the high-elevation plants due to increased UV exposure.
- B. The environment at high elevation altered gene expression, resulting in a different phenotype from the same genotype.
- C. Natural selection at high elevation favored shorter individuals over the course of the experiment.
- D. The high-elevation plants inherited different alleles for height from their parents.
Show answer (B)
Question 2: BASIC CALCULATION
- A. Both genotypes show equal phenotypic plasticity for wing length.
- B. Genotype 2 is more plastic than Genotype 1 because its wings are always shorter.
- C. Genotype 1 shows greater phenotypic plasticity because its wing length changes by 0.8 mm across environments compared to 0.1 mm for Genotype 2.
- D. Genotype 2 is more plastic because it maintains a consistent phenotype across temperatures.
Show answer (C)
Question 3: INTERMEDIATE
- A. Type 2 diabetes is caused entirely by environmental factors.
- B. Type 2 diabetes is a multifactorial trait influenced by both genotype and environment.
- C. Type 2 diabetes follows a simple Mendelian autosomal recessive inheritance pattern.
- D. The twin who develops diabetes must have acquired a de novo mutation.
Show answer (B)
Question 4: APPLIED
Show answer
Question 5: CRITICAL THINKING