

SECTION 1
Historical Context & Motivation
For centuries, naturalists observed that predators were rarer than their prey and herbivores outnumbered carnivores, yet no one had a quantitative framework to explain why. The question of how energy moves through living systems required the convergence of thermodynamics and ecology—two fields that developed largely in parallel during the nineteenth and early twentieth centuries. Understanding energy flow became essential to explaining the structure and function of every ecosystem on Earth.
1859 • Darwin's Ecological Insights
1927 • Elton's Food Chains
1942 • Lindeman's Trophic Dynamics
1957 • Odum's Ecosystem Energetics
2000s • Modern Global Models
Lindeman's work raised a pivotal question that remains central to ecology: Why is so much energy lost between trophic levels, and what consequences does this inefficiency have for ecosystem structure? Answering this question draws on the laws of thermodynamics, cellular respiration, and the ecological relationships among producers, consumers, and decomposers.
SECTION 2
Core Principles of Energy Flow
Energy flow in ecosystems is governed by fundamental physical laws and biological processes. Unlike nutrients, which cycle through ecosystems, energy follows a unidirectional path—it enters as sunlight (or, in rare cases, as chemical energy from chemosynthesis), passes through a series of organisms, and ultimately dissipates as heat. The following principles underpin every aspect of ecosystem energetics.
First Law of Thermodynamics
Second Law of Thermodynamics
Trophic Levels
Gross vs. Net Production
Trophic Efficiency
KEY TAKEAWAY
SECTION 3
Visualizing Energy Flow: The Ecological Pyramid
The pyramid of energy is the most reliable type of ecological pyramid because, unlike pyramids of numbers or biomass, it never inverts. The second law of thermodynamics guarantees that each successive trophic level must contain less available energy than the one below it. A pyramid of biomass can invert in aquatic systems where phytoplankton reproduce rapidly and are consumed almost as fast as they grow, giving the impression of less producer biomass than consumer biomass at any instant. However, when measured over time as energy per unit area per year, the base always exceeds the level above it.
AP Exam Tip
SECTION 4
Mathematical Framework of Energy Flow
Quantifying energy flow requires a set of interconnected equations that relate solar input, photosynthetic fixation, respiratory losses, and trophic transfer. These relationships allow ecologists to build complete energy budgets for ecosystems and predict the amount of biomass sustainable at each trophic level.
NET PRIMARY PRODUCTIVITY
NPP = net primary productivity (energy available to consumers); GPP = gross primary productivity (total energy fixed by photosynthesis); Rₐ = autotroph respiration. NPP represents the energy actually incorporated into plant biomass and thus available to the next trophic level.
NET SECONDARY PRODUCTIVITY
NSP = net secondary productivity, the energy a consumer assimilates into new biomass (growth and reproduction). Not all ingested food is assimilated; some exits as feces. Of the assimilated fraction, a significant portion is used in cellular respiration.
TROPHIC EFFICIENCY
Trophic efficiency typically ranges from 5% to 20%, with a commonly cited average of approximately 10%. This efficiency determines how many trophic levels an ecosystem can sustain.
ASSIMILATION EFFICIENCY
Herbivores typically assimilate 20–50% of ingested energy (plant cell walls are difficult to digest), whereas carnivores assimilate 60–90% because animal tissue is more easily broken down enzymatically.
These equations illustrate a critical asymmetry: energy enters ecosystems through a single gateway—photosynthesis (or chemosynthesis)—but exits through multiple pathways at every trophic level, including metabolic heat, fecal matter, and decomposition. This irreversible dissipation means that food chains rarely exceed four or five links; the energy remaining at the top is simply too small to sustain another predator population.
SECTION 5
Detailed Trophic Structure & Energy Budgets
A comprehensive energy budget tracks every kilojoule from the moment sunlight strikes a leaf to the moment heat radiates from the body of a top predator. The diagram below traces energy through a generalized terrestrial ecosystem, showing the partitioning at each trophic level into biomass production, respiration, and export to detritivores.
| Trophic Level | Examples | Typical Assimilation Efficiency | Energy Available (relative) |
|---|---|---|---|
| Producers | Grasses, trees, phytoplankton | 1–2% of sunlight → GPP | 100% of NPP |
| Primary consumers | Herbivores: deer, zooplankton | 20–50% | ~10% of NPP |
| Secondary consumers | Carnivores: frogs, small fish | 60–90% | ~1% of NPP |
| Tertiary consumers | Top predators: hawks, sharks | 60–90% | ~0.1% of NPP |
| Decomposers | Fungi, bacteria | Variable | Process detritus from all levels |
Energy availability and assimilation efficiency by trophic level
SECTION 6
Worked Example: Building an Energy Budget
Consider a grassland ecosystem where the gross primary productivity is 8,000 kcal/m²/yr and producers use 60% of that energy for their own cellular respiration. Assuming a trophic efficiency of 10% between each consumer level, calculate the energy available at each trophic level up to tertiary consumers.
Grassland Energy Budget Calculation
- 1
Step 1 — Calculate Net Primary Productivity (NPP)
NPP = GPP − Rₐ. The producers respire 60% of GPP, so Rₐ = 0.60 × 8,000 = 4,800 kcal/m²/yr. Therefore, NPP = 8,000 − 4,800.NPP = 3,200 kcal/m²/yr - 2
Step 2 — Energy at Primary Consumer Level
Applying 10% trophic efficiency: Energy at primary consumers = 0.10 × 3,200.Primary consumers = 320 kcal/m²/yr - 3
Step 3 — Energy at Secondary Consumer Level
Energy at secondary consumers = 0.10 × 320.Secondary consumers = 32 kcal/m²/yr - 4
Step 4 — Energy at Tertiary Consumer Level
Energy at tertiary consumers = 0.10 × 32.Tertiary consumers = 3.2 kcal/m²/yr - 5
Step 5 — Interpret the Result
Of the original 8,000 kcal/m²/yr fixed by producers, only 3.2 kcal/m²/yr (0.04%) is available to top predators. This dramatic energy reduction explains why food chains seldom exceed four to five trophic levels and why top predator populations are always small relative to producers.
SECTION 7
Comparing Ecosystem Types & Energy Flow Patterns
Not all ecosystems transfer energy with equal efficiency. Differences in producer type, consumer physiology, and environmental conditions cause wide variation in trophic efficiency and total productivity. The table below compares key features of major ecosystem types, highlighting how energy flow patterns differ.
| Feature | Terrestrial Ecosystems | Aquatic / Marine Ecosystems |
|---|---|---|
| Dominant producers | Vascular plants (trees, grasses) with large structural biomass | Phytoplankton (unicellular algae, cyanobacteria) with minimal structural biomass |
| Biomass pyramid | Always upright; producers hold most standing biomass | May invert; high turnover means consumer biomass can exceed producer standing crop |
| Herbivore assimilation | Low (20–50%) due to cellulose and lignin | Higher (50–70%); phytoplankton lack woody cell walls |
| Detrital vs. grazing | Most energy flows through the detrital pathway (dead leaves, wood) | A larger fraction flows through the grazing food chain |
| Consumer thermoregulation | Many endotherms (birds, mammals) with high respiratory costs | Mostly ectotherms (fish, invertebrates) with lower respiratory costs, increasing trophic efficiency |
Comparison of energy flow characteristics in terrestrial vs. aquatic ecosystems
KEY TAKEAWAY
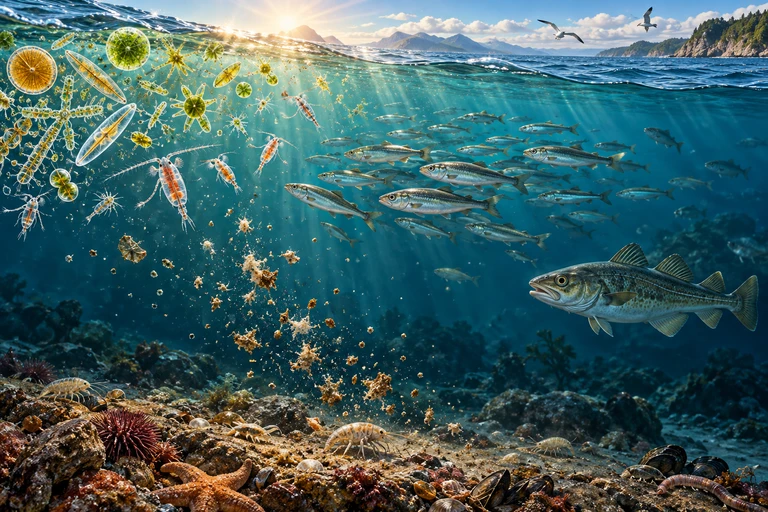 Standing biomass is a stock; production is a rate. Rapid producer turnover can support a larger consumer stock even as energy production decreases between trophic levels.
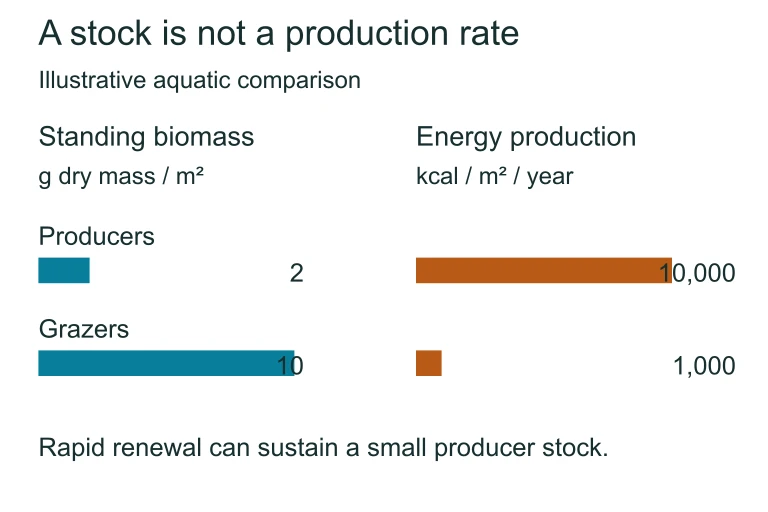 Standing biomass is a stock; production is a rate. Rapid producer turnover can support a larger consumer stock even as energy production decreases between trophic levels.
SECTION 8
Connections to Advanced Ecological Theory
Energy flow concepts serve as the foundation for more sophisticated models in ecology. Understanding how energy moves through ecosystems connects to population dynamics, biodiversity theory, and pressing global issues like climate change and food security. The table below links the foundational ideas from this lesson to advanced topics you may encounter in college ecology courses or on AP free-response questions.
| Foundational Concept | Advanced Connection |
|---|---|
| 10% trophic efficiency | Determines carrying capacity at each trophic level; models like Lotka-Volterra predator-prey dynamics depend on energy availability |
| NPP = GPP − Rₐ | Global NPP models use satellite NDVI data to predict ecosystem responses to elevated CO₂ and temperature |
| Pyramids of energy | Bioaccumulation and biomagnification of toxins (DDT, mercury) intensify at higher trophic levels because consumers process large volumes of prey |
| Energy limits food chain length | The 'green world hypothesis' and trophic cascade theory (top-down vs. bottom-up control) |
| Detrital vs. grazing pathways | Carbon cycling and the biological pump in marine ecosystems; impacts of deforestation on decomposition rates |
Linking foundational energy flow concepts to advanced ecology
One of the most consequential applications of energy flow principles is in understanding biological magnification. Because a secondary consumer must eat many primary consumers to obtain sufficient energy, any persistent toxin present in the prey accumulates to higher concentrations in the predator's tissues. This is why top predators such as bald eagles experienced catastrophic population declines due to DDT—a direct consequence of the thermodynamic inefficiency of energy transfer between trophic levels. Additionally, debates about sustainable agriculture hinge on energy flow: feeding crops directly to humans (acting as primary consumers) is roughly ten times more energy-efficient than feeding crops to livestock and then consuming the animal products.
SECTION 9
Practice Problems
Question 1: CONCEPTUAL
- A. Individual phytoplankton are smaller than zooplankton, so the pyramid of numbers inverts but biomass does not.
- B. Decomposers consume so much producer biomass that less remains than consumer biomass.
- C. Phytoplankton turnover is extremely rapid, so standing crop biomass at any instant can be less than consumer biomass despite higher productivity over time.
- D. Phytoplankton have a lower photosynthetic efficiency than terrestrial plants, leading to less total biomass in the ocean.
Show answer (C)
Question 2: BASIC CALCULATION
- A. 2,400 kcal/m²/yr
- B. 1,080 kcal/m²/yr
- C. 7,920 kcal/m²/yr
- D. 2,000 kcal/m²/yr
Show answer (B)
Question 3: INTERMEDIATE
- A. Assimilation efficiency = 60%; net production efficiency = 12%
- B. Assimilation efficiency = 60%; net production efficiency = 20%
- C. Assimilation efficiency = 40%; net production efficiency = 12%
- D. Assimilation efficiency = 60%; net production efficiency = 48%
Show answer (A)
Question 4: APPLIED
4 ptsShow answer
Question 5: CRITICAL THINKING
4 ptsShow answer
SUMMARY
Summary: Energy Flow Through Ecosystems
Summary
Energy enters ecosystems primarily through photosynthesis, where autotrophs convert solar energy into chemical energy measured as gross primary productivity (GPP). After subtracting autotroph respiration, the remaining net primary productivity (NPP) becomes available to consumers. At each successive trophic level, approximately 10% of energy is transferred to the next level, with the remaining 90% lost to cellular respiration (heat), fecal losses, and the detrital food web. This progressive energy loss, mandated by the second law of thermodynamics, explains why pyramids of energy never invert and why food chains rarely exceed four to five links.
Key quantitative relationships include NPP = GPP − Rₐ and trophic efficiency = production at level n / production at level n−1. Differences between terrestrial and aquatic ecosystems—such as endotherm vs. ectotherm energetics and producer turnover rates—cause variation in trophic efficiency and can invert biomass pyramids even though energy pyramids remain upright. These principles connect directly to biological magnification, trophic cascades, and global models of ecosystem productivity under climate change.