
SECTION 1
Historical Context & Motivation
Ecologists have long recognized that ecosystems are not static, self-perpetuating entities but dynamic systems shaped by periodic disturbances. Early naturalists such as Charles Darwin observed that volcanic eruptions, storms, and human land use profoundly altered species assemblages, yet it was not until the twentieth century that ecology developed formal frameworks for understanding how disruptions restructure biological communities. The question that drove this field was deceptively simple: why do some ecosystems recover from catastrophic disturbance while others shift to entirely new states?
1916 • Clements's Succession Model
1958 • Whittaker's Individualistic Continuum
1978 • Connell's Intermediate Disturbance Hypothesis
1980 • Mount St. Helens Eruption
2005 • Millennium Ecosystem Assessment
These milestones reveal a fundamental shift in ecological thinking: disturbances are not merely destructive events from which ecosystems must "heal," but integral forces that shape species composition, nutrient cycling, and energy flow. The central question for AP Biology is how disruptions—ranging from fires and floods to invasive species and climate change—alter the structure and function of ecological communities, and what determines whether an ecosystem can recover or transitions to a novel state.
SECTION 2
Core Principles & Definitions
An ecosystem disruption is any event or process that significantly alters the structure, composition, or function of a biological community and its abiotic environment. Disruptions vary in origin (natural versus anthropogenic), scale (local versus global), intensity, frequency, and duration. Understanding these dimensions is essential because the same type of disturbance can have drastically different outcomes depending on its specific characteristics and the resilience of the affected community.
Resistance
Resilience
Ecological Succession
Keystone & Foundation Species
Trophic Cascades
SECTION 3
Trophic Cascade — Visual Explanation
One of the most instructive examples of ecosystem disruption is the trophic cascade triggered by the removal or reintroduction of an apex predator. The diagram below illustrates how the loss of wolves from Yellowstone National Park allowed elk populations to explode, leading to overgrazing of riparian vegetation, bank erosion, and declines in songbird and beaver populations. When wolves were reintroduced in 1995, the cascade reversed: elk browsing pressure decreased, willows and aspens regenerated along streams, beavers returned, and the physical structure of the river channels changed—demonstrating that a single disruption at the top of a food web can reshape an entire landscape.
This Yellowstone case study illustrates a critical AP Biology concept: disruptions do not remain confined to the trophic level where they originate. The removal of a single apex predator triggered changes that cascaded through herbivores, primary producers, other consumer species, and even the physical landscape. This interconnectedness is precisely why ecologists emphasize the importance of food-web complexity and biodiversity: the more pathways exist for energy and nutrients to flow, the more buffered the system is against the loss of any single component.
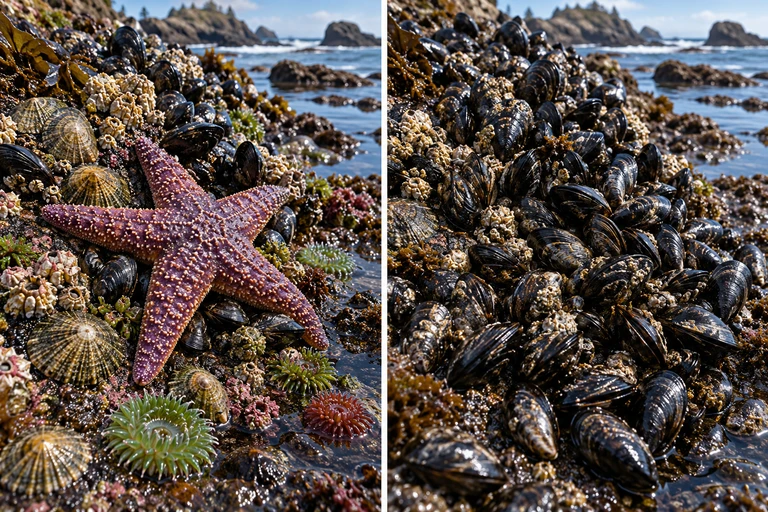 Sea-star predation can reduce mussel dominance and indirectly release other sessile species from competition. A removal experiment compares treated and control plots through time.
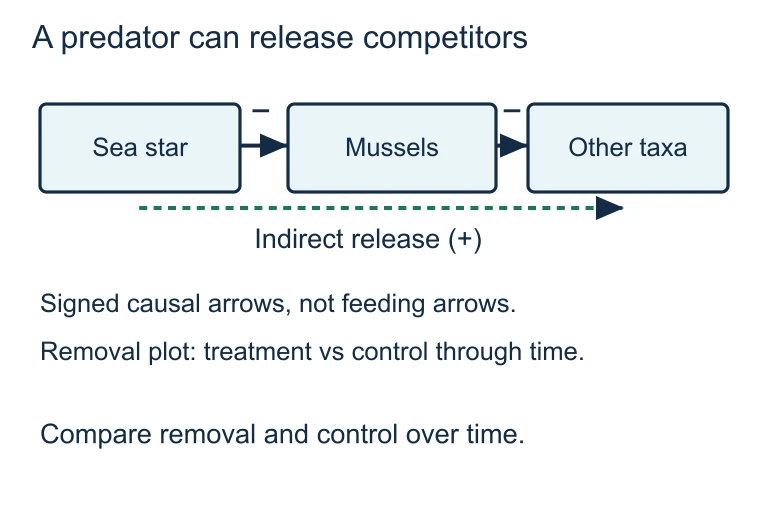 Sea-star predation can reduce mussel dominance and indirectly release other sessile species from competition. A removal experiment compares treated and control plots through time.
SECTION 4
Mechanisms of Ecosystem Disruption
Ecosystem disruptions operate through several interrelated mechanisms that alter the flow of energy, the cycling of matter, and the interactions among species. While the AP Biology curriculum does not emphasize extensive mathematical modeling of disruptions, understanding a few quantitative relationships helps clarify why some disturbances have outsized effects.
Energy Flow & Net Primary Productivity
NET PRIMARY PRODUCTIVITY
NPP = net primary productivity (energy available to consumers); GPP = gross primary productivity (total photosynthetic output); Ra = autotrophic respiration. Disruptions that reduce producer biomass (deforestation, herbicide runoff) directly decrease NPP, limiting energy available to all higher trophic levels.
TROPHIC EFFICIENCY
Typically ~10% between successive trophic levels. Because energy transfer is so inefficient, disruptions at lower trophic levels (e.g., loss of primary producers) have magnified effects on higher-level consumers that depend on a progressively smaller fraction of the original energy input.
Bioaccumulation & Biomagnification
BIOMAGNIFICATION FACTOR
A BMF > 1 indicates biomagnification: the toxin is accumulating at higher concentrations in each successive trophic level. DDT famously reached BMFs exceeding 106 in apex predators like peregrine falcons, causing eggshell thinning and population collapse.
Invasive Species & Competitive Displacement
When an invasive species enters an ecosystem, it often lacks natural predators, parasites, or pathogens that regulate its population in its native range—a phenomenon termed enemy release. The competitive exclusion principle predicts that two species competing for identical resources cannot coexist indefinitely; the invader may outcompete native species for food, nesting sites, or light. In addition, invasive species may alter nutrient cycles (e.g., nitrogen-fixing plants enriching previously nutrient-poor soils), facilitate the introduction of novel pathogens, or physically restructure habitats—all mechanisms by which a single introduced species can reorganize community composition and ecosystem function.
SECTION 5
Classification of Ecosystem Disruptions
Disruptions are broadly classified by their origin, spatial scale, and whether they remove biological legacies (soil, seed banks, surviving organisms). The diagram below contrasts the five major categories of anthropogenic disruption identified by the Millennium Ecosystem Assessment, while the table that follows integrates natural disturbance types for a comprehensive view.
| Disruption Type | Example | Primary Mechanism | Succession Type |
|---|---|---|---|
| Wildfire | Yellowstone fires (1988) | Removes biomass; releases nutrients to soil; opens canopy | Secondary |
| Volcanic eruption | Mount St. Helens (1980) | Buries landscape in ash/lava; destroys all biological legacies | Primary |
| Invasive species | Zebra mussels in Great Lakes | Filter-feeding removes phytoplankton; redirects energy from pelagic to benthic food webs | N/A (ongoing) |
| Eutrophication | Gulf of Mexico dead zone | Excess N and P trigger algal blooms → decomposition depletes dissolved O₂ | N/A (chronic) |
| Climate change | Coral bleaching (Great Barrier Reef) | Thermal stress expels zooxanthellae; reduces reef-building capacity | Potential regime shift |
Major ecosystem disruptions, mechanisms, and successional consequences
SECTION 6
Worked Example: Eutrophication & Dead Zones
The following worked example traces how agricultural nutrient runoff disrupts an aquatic ecosystem, step by step. This type of causal-chain reasoning is frequently tested in AP Biology free-response questions.
Worked example
- 1
Step 1 — Identify the Disruption Source
Fertilizer runoff from Midwestern agricultural fields carries excess nitrogen (NO₃⁻) and phosphorus (PO₄³⁻) into the Mississippi River watershed. These nutrients are transported downstream and discharged into the Gulf of Mexico. The disruption is anthropogenic, chronic, and operates at a regional scale.Input: excess N and P nutrients enter aquatic system - 2
Step 2 — Primary Producer Response
The influx of limiting nutrients removes the constraint on phytoplankton and cyanobacteria growth. According to Liebig's law of the minimum, the nutrient that was previously in shortest supply now becomes abundant, triggering an algal bloom—a massive increase in surface-layer primary productivity. The dense algal mat blocks light penetration, killing submerged aquatic vegetation below.Effect: algal bloom → loss of submerged vegetation - 3
Step 3 — Decomposition & Oxygen Depletion
When the bloom-forming algae die, they sink to the bottom and are consumed by aerobic decomposers (bacteria). The massive pulse of organic matter fuels bacterial respiration, which rapidly depletes dissolved oxygen (DO) in the water column. When DO drops below ~2 mg/L, the area becomes a hypoxic zone or "dead zone."Effect: dissolved O₂ < 2 mg/L → hypoxic dead zone - 4
Step 4 — Community-Level Consequences
Mobile organisms (fish, shrimp) flee the hypoxic zone, reducing local species richness and disrupting fisheries. Sessile organisms (bivalves, benthic invertebrates) cannot escape and suffer mass mortality. The loss of these consumer species further alters nutrient cycling—for example, bivalve filter-feeders that would normally remove algae are eliminated, creating a positive feedback loop that reinforces eutrophication.Outcome: reduced biodiversity, fishery collapse, positive feedback reinforcing disruption - 5
Step 5 — Evaluate Recovery Potential
Recovery requires reducing nutrient inputs at the source. Because sediment phosphorus pools and altered benthic communities create internal loading, even after external inputs decrease the system may remain in a eutrophic state for years—an example of an alternative stable state. The Gulf of Mexico dead zone has persisted seasonally since the 1970s and currently averages approximately 14,000 km².Conclusion: chronic disruption may push systems into alternative stable states resistant to recovery
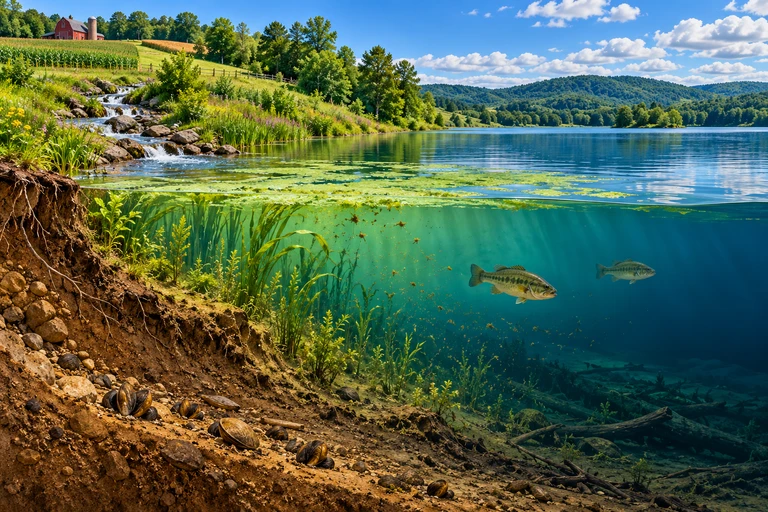 Nutrient enrichment can increase algal production. Sinking organic matter fuels aerobic decomposer respiration, which consumes dissolved oxygen; restricted mixing can worsen bottom-water hypoxia.
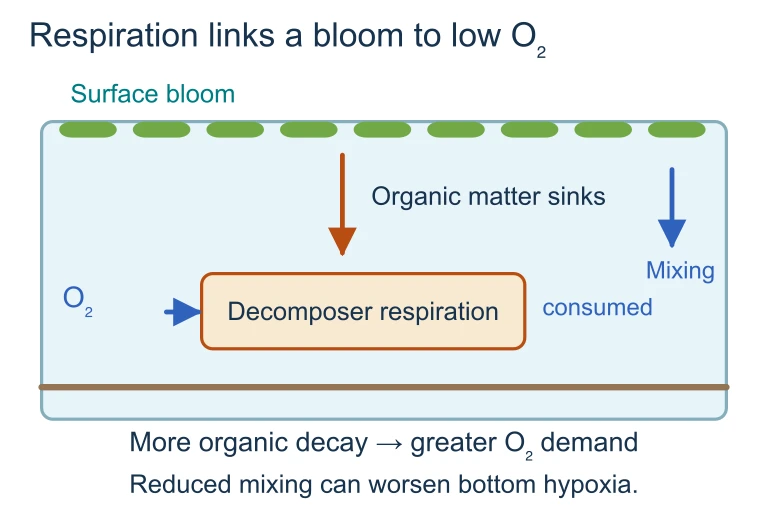 Nutrient enrichment can increase algal production. Sinking organic matter fuels aerobic decomposer respiration, which consumes dissolved oxygen; restricted mixing can worsen bottom-water hypoxia.
SECTION 7
Natural vs. Anthropogenic Disruptions
A common AP Biology question type asks students to compare and contrast natural and human-caused disruptions. While both can profoundly alter ecosystems, they differ in several key dimensions that influence whether and how quickly recovery occurs.
| Dimension | Natural Disruptions | Anthropogenic Disruptions |
|---|---|---|
| Evolutionary history | Species have often evolved adaptations to recurring natural disturbances (e.g., fire-dependent seed germination in chaparral) | Novel stressors (synthetic pesticides, microplastics) may not have any evolutionary analog, so species lack adaptive responses |
| Frequency & Predictability | Often periodic and somewhat predictable (seasonal floods, fire return intervals), allowing co-evolved community responses | May be continuous (pollution), sudden (oil spills), or accelerating (climate change), outpacing adaptive capacity |
| Spatial scale | Usually local to regional; surrounding intact habitat serves as a source for recolonization | Can be global (climate change, ozone depletion); fragmented landscapes limit dispersal corridors for recolonizers |
| Biological legacy | Often preserves soil, seed banks, and surviving organisms that accelerate secondary succession | May strip biological legacies entirely (e.g., mountaintop removal mining) or contaminate soil, hindering recovery |
| Synergistic effects | Typically operate independently or in well-characterized combinations | Multiple anthropogenic stressors interact unpredictably (e.g., warming + acidification + overfishing on coral reefs) |
Key differences between natural and anthropogenic ecosystem disruptions
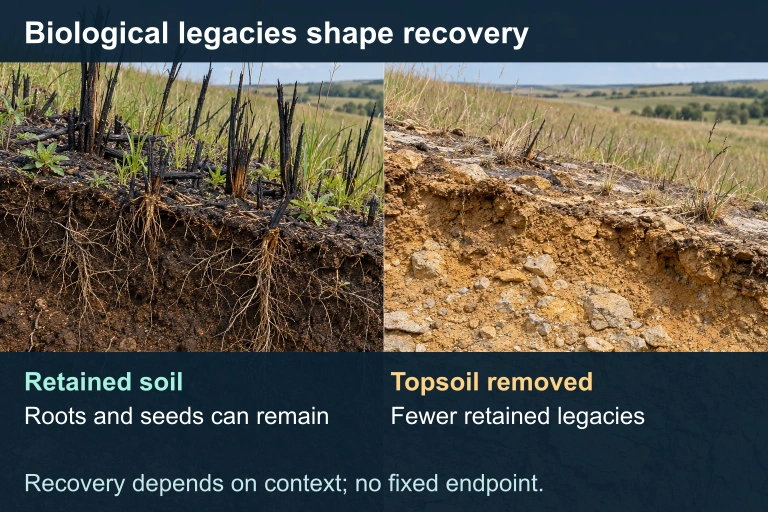 Retained soil can preserve roots and a seed bank; removed topsoil leaves fewer biological legacies. Recovery depends on context.
SECTION 8
Regime Shifts & Ecological Thresholds
The most consequential outcome of ecosystem disruption is a regime shift—a rapid, often irreversible transition from one stable ecological state to another. Contemporary ecological theory frames this concept using alternative stable state models, in which an ecosystem can exist in multiple configurations (e.g., a clear-water lake with submerged vegetation versus a turbid, algae-dominated lake), and the transition between states is governed by critical thresholds. Once a threshold is crossed, positive feedback loops lock the system into the new state, making recovery difficult even if the original stressor is removed.
| Concept | AP Biology Level | Advanced Ecological Theory |
|---|---|---|
| Succession | Linear sequence from pioneer to climax community; generally predictable | Multiple successional pathways; priority effects and stochastic assembly; climax concept largely abandoned |
| Resilience | Ability to return to original state after disturbance | Measured as the size of the 'basin of attraction'—how large a perturbation the system can absorb before shifting to an alternative state |
| Biodiversity–stability | Greater biodiversity generally increases ecosystem stability | Insurance hypothesis: functional redundancy among species buffers ecosystem processes; portfolio effect reduces variance in aggregate properties |
| Tipping points | Some disruptions cause permanent changes | Hysteresis: the path to degradation differs from the path to recovery, requiring greater remediation effort than the original disturbance magnitude |
AP-level versus advanced ecological frameworks for understanding disruption
For the AP exam, you should be able to explain how human activities push ecosystems toward threshold transitions and why positive feedback loops make recovery nonlinear. A coral reef that loses its coral cover due to bleaching, for instance, is colonized by macroalgae that further inhibit coral recruitment, creating a feedback loop that maintains the degraded state even if water temperatures return to normal. Recognizing these dynamics connects the topic of ecosystem disruption to broader themes of homeostasis, feedback regulation, and the emergent properties of complex biological systems.
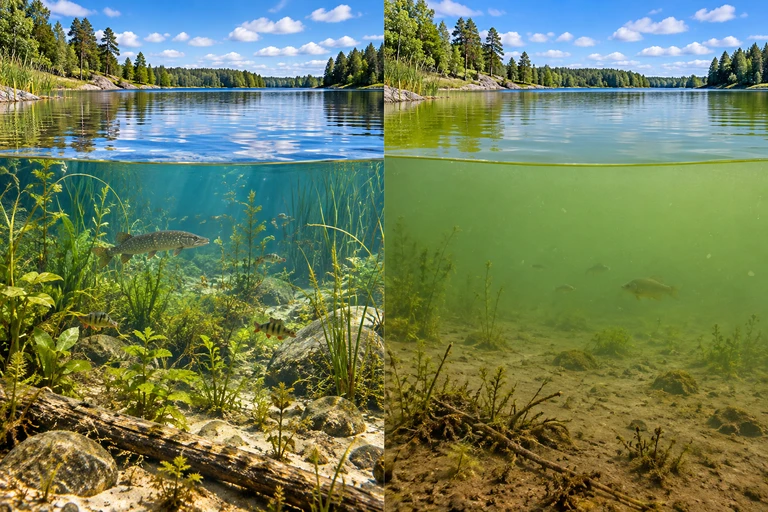 Submerged plants reduce sediment resuspension; resuspension raises turbidity, and turbidity suppresses plant growth. This reinforcing loop can maintain a turbid shallow lake; evidence of hysteresis requires more than persistence alone.
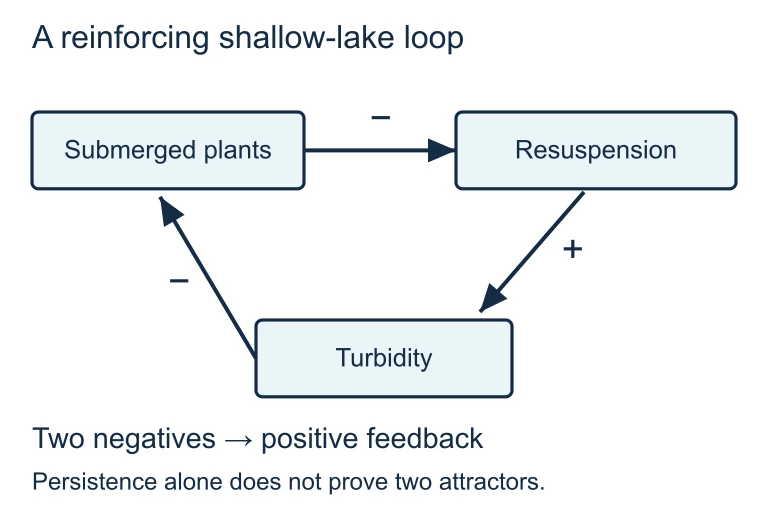 Submerged plants reduce sediment resuspension; resuspension raises turbidity, and turbidity suppresses plant growth. This reinforcing loop can maintain a turbid shallow lake; evidence of hysteresis requires more than persistence alone.
SECTION 9
Practice Problems
Question 1: CONCEPTUAL
- A. Primary succession, beginning with lichens colonizing bare rock
- B. Secondary succession, beginning with fast-growing herbaceous species exploiting intact soil and seed banks
- C. A permanent regime shift to grassland because the climax tree species were eliminated
- D. No succession, because the disturbance exceeded the ecosystem's resistance threshold
Show answer (B)
Question 2: BASIC CALCULATION
- A. 0.6 kcal/m²/year
- B. 6.0 kcal/m²/year
- C. 10 kcal/m²/year
- D. 60 kcal/m²/year
Show answer (B)
Question 3: INTERMEDIATE
- A. The invasive fish out-competed phytoplankton for dissolved nutrients, altering light penetration
- B. The invasive fish preyed on zooplankton, releasing phytoplankton from grazing pressure in a top-down trophic cascade
- C. The invasive fish introduced a novel pathogen that selectively killed zooplankton through direct transmission
- D. The invasive fish increased nutrient cycling by consuming benthic detritus, causing bottom-up eutrophication
Show answer (B)
Question 4: APPLIED
4 ptsShow answer
Question 5: CRITICAL THINKING
4 pts