
SECTION 1
Historical Context & Motivation
The idea that organisms share a common origin predates Charles Darwin, but it was Darwin who first marshaled a compelling body of evidence to argue that all living species descend—with modification—from shared ancestors. Before his work, naturalists such as Linnaeus had noticed that organisms fall into nested hierarchical groups, yet they attributed this pattern to a divine plan rather than to branching descent. The central question that the concept of common ancestry addresses is deceptively simple: why do structurally and genetically similar organisms exist in coherent, hierarchical patterns across the tree of life?
1735 • Linnaean Taxonomy
1859 • On the Origin of Species
1953 • DNA Structure Elucidated
1977 • Woese's Three Domains
2003 • Human Genome Project Completed
From Linnaeus's intuitive groupings to genome-wide comparisons, the recurring theme is that life's diversity is organized in a pattern best explained by branching descent from shared ancestors. The rest of this lesson examines the multiple, independent lines of evidence that support this conclusion and explains how biologists reconstruct evolutionary relationships.
SECTION 2
Core Principles of Common Ancestry
Common ancestry is not a single observation; it is an inference drawn from converging evidence across multiple biological disciplines. At its core, the principle states that any two species, when traced far enough back through time, share an ancestral population from which both lineages diverged. The strength of this inference grows as independent data sets—morphological, molecular, embryological, and biogeographic—point to the same branching pattern.
Homologous Structures
Molecular Homology
Biogeography
Fossil Record
Embryological Similarities
SECTION 3
Phylogenetic Trees & Visual Explanation
The primary visual tool for representing common ancestry is the phylogenetic tree (also called a cladogram when branch lengths are not scaled to time). In a phylogenetic tree, each internal node represents a hypothetical most recent common ancestor (MRCA) of the taxa descending from it, and the tips of the branches represent extant or extinct species. Branching order, not branch length or left-right placement, communicates evolutionary relationships.
When interpreting a phylogenetic tree, focus on which taxa share the most recent common ancestor. In the diagram above, Human and Mouse are more closely related to each other than either is to Chicken because they share the mammal ancestor node—a node not shared with Chicken. Chicken, in turn, is more closely related to the mammals than to Frog, because all three share the amniote ancestor. A common misconception is to read trees left to right as a ladder of progress; in reality, each extant tip is equally evolved from the root.
SECTION 4
Molecular Evidence & Sequence Comparison
Molecular biology provides the most powerful evidence for common ancestry. Because DNA is the hereditary material in all cellular organisms, mutations accumulate over time in a roughly clock-like fashion in selectively neutral regions. By comparing homologous gene or protein sequences between species, biologists can estimate divergence times and reconstruct phylogenies. Two key metrics used in these analyses are percent sequence identity and molecular clock calibration.
PERCENT SEQUENCE IDENTITY
Aligned positions include matches, mismatches, and gaps introduced to optimize the alignment. Higher percent identity between two species indicates a more recent common ancestor.
MOLECULAR CLOCK (SIMPLIFIED)
T = estimated divergence time, D = number of substitutions per site between two sequences, μ = substitution rate per site per unit time. The factor of 2 accounts for independent evolution along both lineages since divergence.
The universality of the genetic code itself is among the strongest arguments for a single common ancestor. All organisms translate codons into the same (or nearly the same) amino acids using transfer RNAs charged by homologous aminoacyl-tRNA synthetases. Random chance alone would not produce this uniformity across Bacteria, Archaea, and Eukarya; inheritance from a last universal common ancestor (LUCA) is the most parsimonious explanation.
SECTION 5
Lines of Evidence in Detail
Beyond molecular data, multiple independent categories of evidence converge on the same phylogenetic patterns. This convergence is critical because any single line of evidence could, in principle, be explained by alternative hypotheses; the power of the common-ancestry inference comes from the agreement among disparate data sets. The diagram below illustrates how these evidence streams reinforce one another.
| Evidence Category | Key Example | What It Shows |
|---|---|---|
| Homologous structures | Pentadactyl limb in mammals, birds, reptiles | Shared skeletal plan despite different functions implies common structural origin |
| Vestigial structures | Human appendix, whale pelvic bones | Reduced or non-functional structures inherited from ancestors in which they were functional |
| Molecular homology | Cytochrome c amino acid sequences | Degree of sequence similarity correlates with phylogenetic relatedness |
| Biogeography | Darwin's finches on Galápagos | Geographically isolated populations diverge into distinct species (adaptive radiation) |
| Fossil record | Tiktaalik (fish → tetrapod transition) | Transitional forms document morphological intermediates between major groups |
| Embryology | Pharyngeal arches in vertebrate embryos | Conserved developmental stages reflect shared genetic regulatory programs |
Summary of major evidence categories for common ancestry
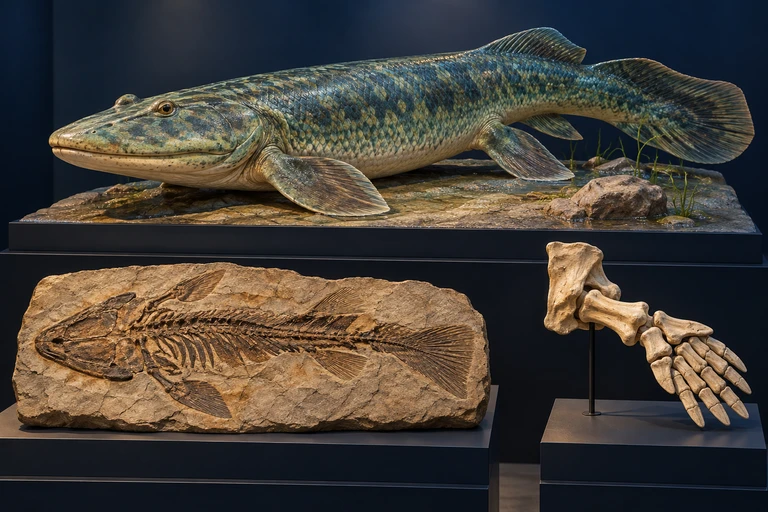 Compare fossils, corresponding anatomical structures and molecular sequences with a branching hypothesis. Tiktaalik is a transitional relative, without requiring it to be a direct ancestor of a particular living lineage.
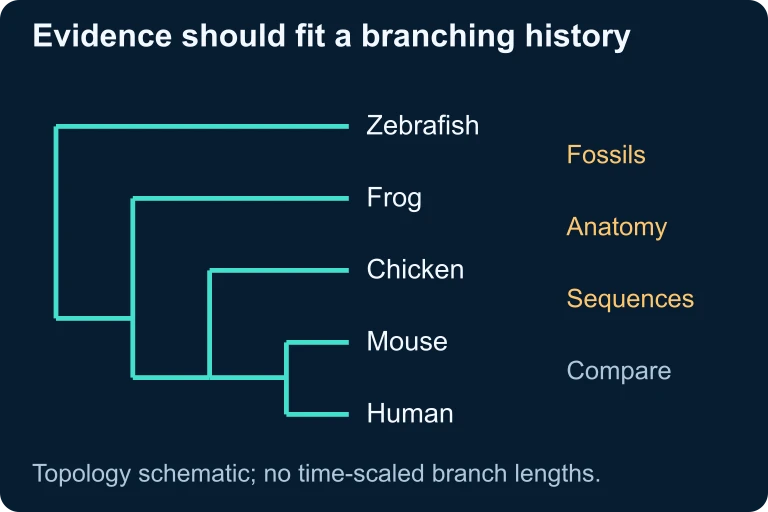 Compare fossils, corresponding anatomical structures and molecular sequences with a branching hypothesis. Tiktaalik is a transitional relative, without requiring it to be a direct ancestor of a particular living lineage.
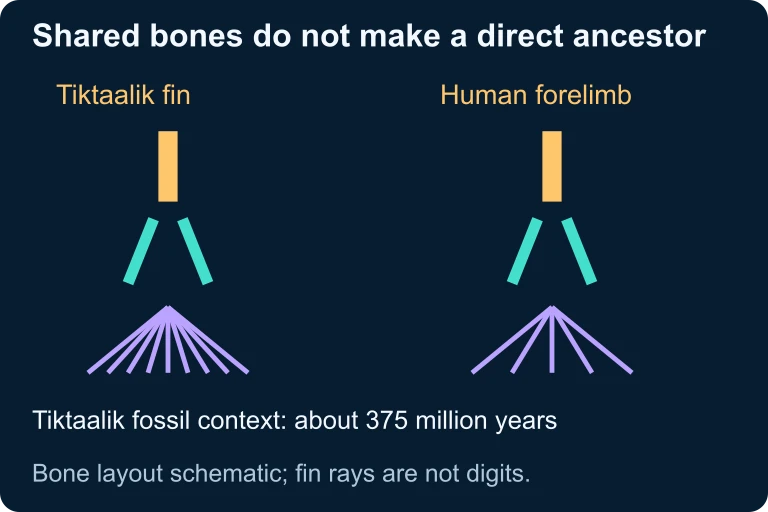 Tiktaalik lived about 375 million years ago and shares corresponding limb-bone regions with tetrapods. Fin rays differ from digits, and correspondence does not establish direct ancestry.
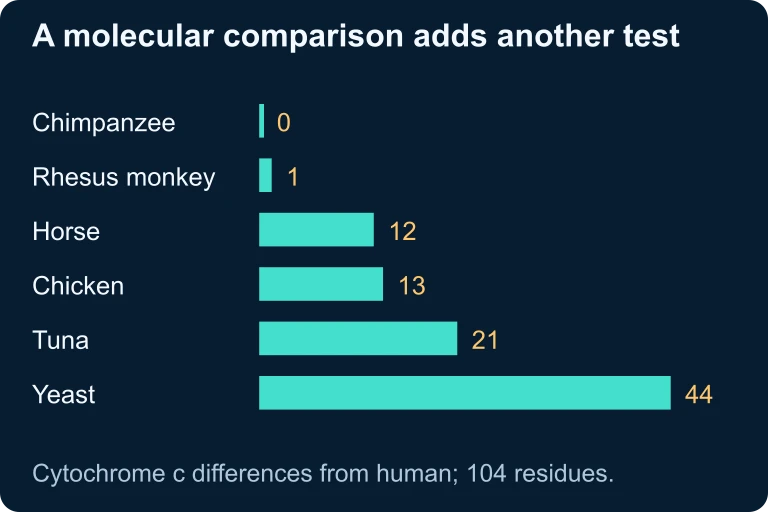 Compare the listed cytochrome c amino-acid differences from the human sequence across the same 104-residue protein.
SECTION 6
Worked Example: Inferring Relatedness from Cytochrome c
Cytochrome c is a highly conserved protein involved in the electron transport chain. Because it performs the same essential function across all aerobic eukaryotes, most of its 104 amino acid positions are strongly constrained, making the remaining variable positions excellent markers of evolutionary divergence. In the worked example below, we compare partial cytochrome c sequences to determine which species share a more recent common ancestor.
Worked example
- 1
Step 1 — Examine the Data
You are given the number of amino acid differences in cytochrome c between several organisms and humans: Chimpanzee = 0, Rhesus monkey = 1, Horse = 12, Chicken = 13, Tuna = 21, Yeast = 44. - 2
Step 2 — Rank by Similarity
Fewer amino acid differences indicate a more recent common ancestor. Rank from most to least similar: Chimpanzee (0) → Rhesus monkey (1) → Horse (12) → Chicken (13) → Tuna (21) → Yeast (44).Chimpanzee is most closely related to humans; Yeast is the most distantly related - 3
Step 3 — Calculate Percent Identity
For human vs. tuna: (104 − 21) / 104 × 100 = 79.8% identity. For human vs. yeast: (104 − 44) / 104 × 100 = 57.7% identity. Even organisms as different as humans and yeast share over half their cytochrome c sequence.Human–Tuna: 79.8% identity | Human–Yeast: 57.7% identity - 4
Step 4 — Draw Phylogenetic Inference
The ranking matches the known phylogenetic tree: primates diverged most recently, followed by other mammals, then birds, bony fish, and finally fungi. This congruence between molecular data and morphological classification is strong evidence that all these organisms descend from a common ancestor whose cytochrome c has been conserved because of its critical role in aerobic respiration.Molecular and morphological phylogenies agree—supporting common ancestry
SECTION 7
Homology versus Analogy: Avoiding Pitfalls
Not every similarity between species is evidence of common ancestry. Analogous structures (also called convergent evolution) arise when unrelated organisms independently evolve similar features in response to similar selective pressures—think of the wings of insects and birds, or the streamlined bodies of sharks and dolphins. Distinguishing homology from analogy is essential for accurate phylogenetic reconstruction.
| Feature | Homology | Analogy (Convergence) |
|---|---|---|
| Origin | Inherited from a shared ancestor | Evolved independently in separate lineages |
| Underlying structure | Similar bone/gene architecture despite different functions | Different underlying anatomy; similar external form |
| Example | Bat wing and human arm (both pentadactyl limbs) | Bat wing and insect wing (no shared skeletal plan) |
| Phylogenetic use | Valid for inferring relatedness | Can mislead phylogenetic analysis if mistaken for homology |
| Molecular test | Shared DNA sequences and synteny | Different genetic basis despite phenotypic similarity |
Homology vs. Analogy comparison
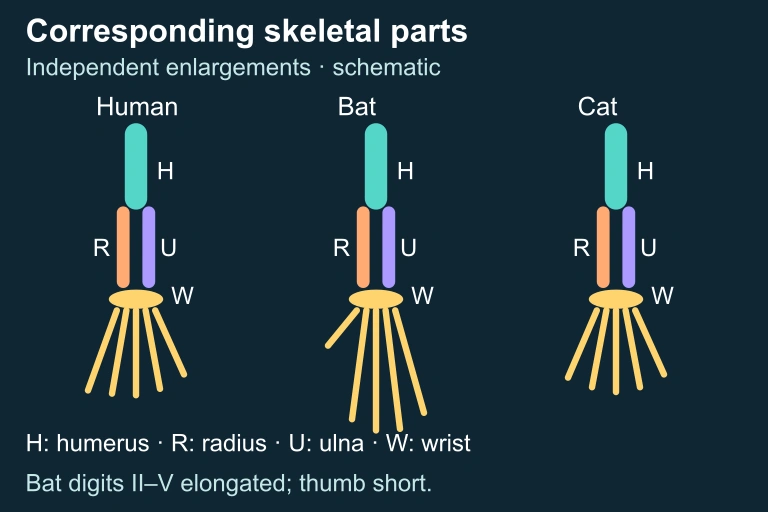 Corresponding skeletal parts
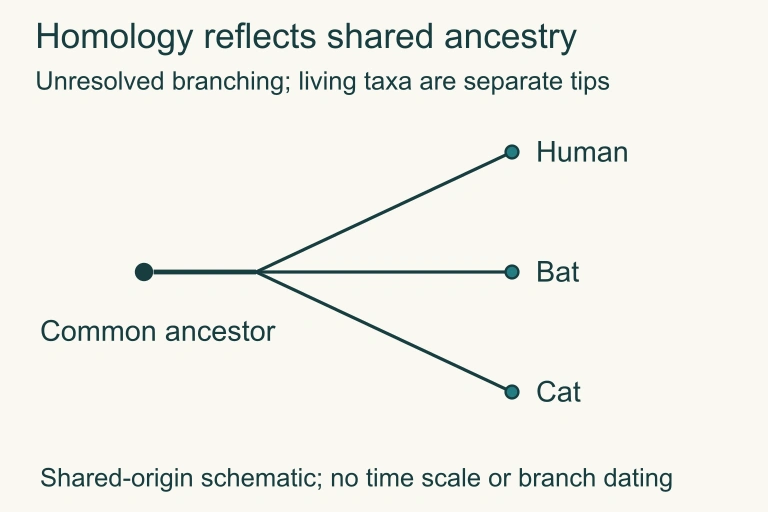 Shared origin schematic
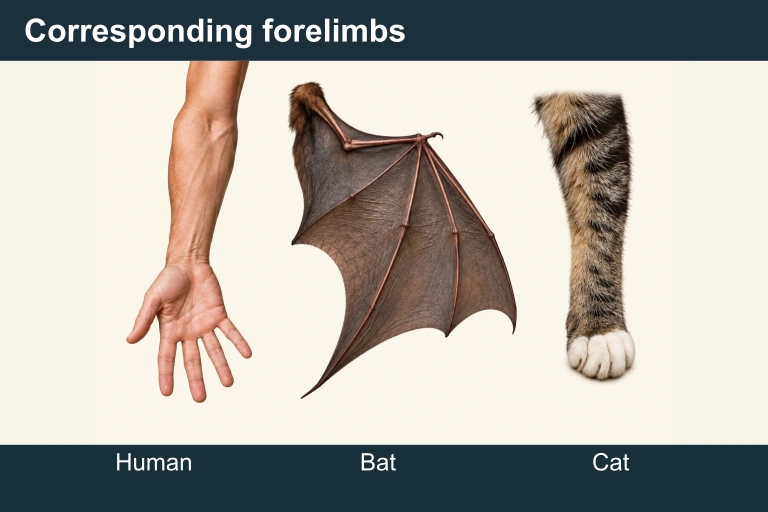 These independently enlarged forelimb topology schematics identify corresponding humerus, radius, ulna, wrist and five digits. They compare homology rather than exact bone shapes or proportions, and do not make living species ancestors of one another.
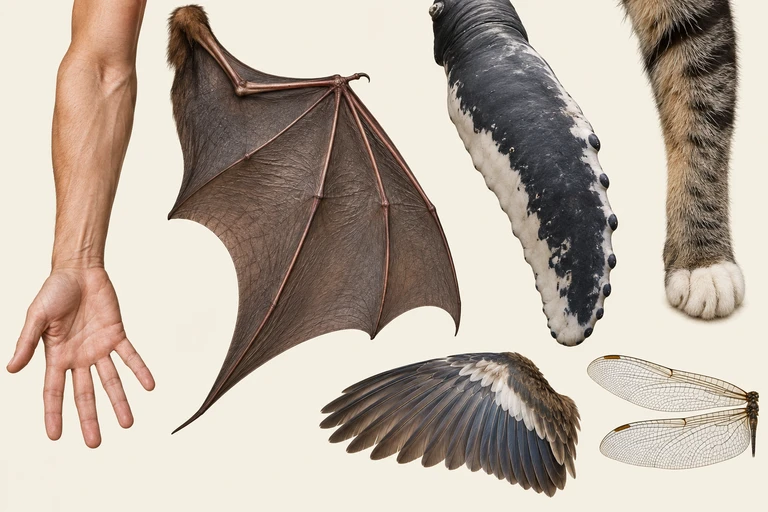 Corresponding forelimb bones reflect shared ancestry despite different functions. Bird and bat forelimb bones are homologous, while bird and insect flight surfaces are analogous.
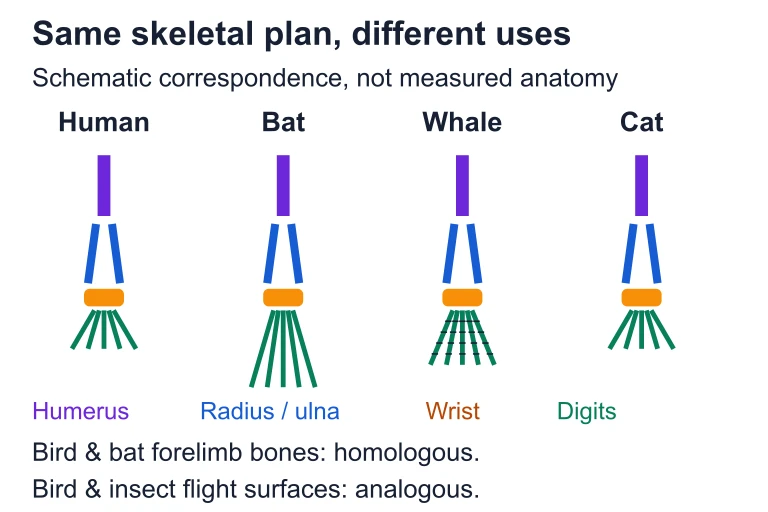 Corresponding forelimb bones reflect shared ancestry despite different functions. Bird and bat forelimb bones are homologous, while bird and insect flight surfaces are analogous.
SECTION 8
Connection to Advanced Evolutionary Theory
The principle of common ancestry is foundational, but modern evolutionary biology extends far beyond Darwin's original framework. Advances in genomics, population genetics, and evo-devo (evolutionary developmental biology) have revealed mechanisms—such as horizontal gene transfer (HGT), endosymbiosis, and gene duplication—that complicate the simple branching-tree model. The table below contrasts the classical view of common ancestry with the modern nuanced perspective.
| Aspect | Classical View | Modern Nuanced View |
|---|---|---|
| Tree topology | Strictly bifurcating tree | Web or network (reticulate evolution) due to HGT, hybridization |
| Gene inheritance | Vertical (parent to offspring) | Both vertical and horizontal (especially in prokaryotes) |
| Organelle origin | Not addressed by Darwin | Mitochondria and chloroplasts arose via endosymbiosis—merging of lineages |
| Data source | Morphology and fossils | Whole-genome sequences, transcriptomics, proteomics |
| Phylogenetic method | Hand-drawn trees based on shared characters | Computational algorithms (maximum likelihood, Bayesian inference) |
Classical vs. Modern Perspectives on Common Ancestry
For the AP Biology exam, it is important to recognize that horizontal gene transfer means that, especially among prokaryotes, the history of individual genes may not match the history of the organisms carrying them. Nevertheless, the overall pattern of nested hierarchical similarity still supports universal common ancestry—even if the 'tree of life' is better described as a 'web of life' at its base. Understanding these complexities prepares you for college-level evolutionary biology courses and the more nuanced questions that appear on the AP exam.
SECTION 9
Practice Problems
Question 1: CONCEPTUAL
- A. Natural selection independently favored the same genetic code in all lineages because it is the only chemically possible code.
- B. All organisms inherited the genetic code from a shared common ancestor (LUCA), and strong purifying selection has maintained it.
- C. Horizontal gene transfer spread the same genetic code from bacteria to all other organisms after life originated multiple times.
- D. The genetic code is not actually universal; major differences exist between prokaryotes and eukaryotes that are often overlooked.
Show answer (B)
Question 2: BASIC CALCULATION
- A. 17.3%
- B. 82.7%
- C. 86.0%
- D. 73.1%
Show answer (B)
Question 3: INTERMEDIATE
- A. The amino acid tree is always more accurate because proteins are the functional molecules.
- B. Synonymous (silent) substitutions in the DNA have accumulated between A and B, inflating the apparent DNA divergence without changing the protein.
- C. Convergent evolution at the amino acid level may cause A and C to appear more similar than they truly are, or synonymous mutations obscure the true DNA-level relationship.
- D. Common ancestry has been disproven for these species because the two data sets are inconsistent.
Show answer (C)
Question 4: APPLIED
Show answer
Question 5: CRITICAL THINKING