
SECTION 1
Historical Context & Motivation
The study of how organisms obtain and use energy is one of the oldest and most consequential threads in biology, linking eighteenth-century chemistry to modern molecular biology. Antoine Lavoisier's demonstration that respiration is a slow combustion fundamentally changed how scientists thought about living matter, replacing vitalistic explanations with measurable chemical processes. Over the next two centuries, researchers progressively dissected cellular respiration and photosynthesis into discrete enzymatic steps, revealing how cells couple exergonic reactions to the endergonic synthesis of ATP — the universal energy currency of life.
1780 • Lavoisier & Respiration
1929 • Discovery of ATP
1937 • The Krebs Cycle
1961 • Chemiosmotic Hypothesis
1997 • ATP Synthase Structure Resolved
These milestones collectively answer a central question in biology: How do cells convert the chemical energy stored in organic molecules into a form that can power endergonic processes such as active transport, biosynthesis, and movement? Understanding cellular energy is therefore essential for grasping virtually every downstream topic in biology, from signal transduction to ecological energy flow.
SECTION 2
Core Principles of Cellular Energy
Cellular energetics rests on principles drawn from both thermodynamics and biochemistry. The laws of thermodynamics constrain what cells can and cannot do: energy is neither created nor destroyed (first law), and every energy transformation increases the entropy of the universe (second law). Within these constraints, cells have evolved remarkably efficient strategies for channeling free energy from nutrient oxidation into the phosphoanhydride bonds of ATP, and then deploying that ATP to drive otherwise unfavorable reactions forward through energy coupling.
Free Energy (ΔG)
ATP as Energy Currency
Redox Reactions & Electron Carriers
Chemiosmosis
Metabolic Regulation
KEY TAKEAWAY
SECTION 3
Overview of Cellular Respiration
Cellular respiration is a multi-stage process that extracts free energy from glucose (and other organic fuels) through a series of controlled redox reactions. The diagram below provides a bird's-eye view of the three major stages — glycolysis in the cytoplasm, the citric acid cycle in the mitochondrial matrix, and oxidative phosphorylation at the inner mitochondrial membrane — showing the flow of carbon, electrons, and ATP.
Notice how each stage feeds products into the next. Glycolysis generates pyruvate, which undergoes oxidative decarboxylation to form acetyl-CoA before entering the citric acid cycle. The NADH and FADH₂ produced throughout these stages carry high-energy electrons to the electron transport chain (ETC), where the bulk of ATP is generated. This staged architecture allows the cell to extract energy incrementally rather than in a single explosive step, minimizing heat loss and maximizing the fraction of free energy captured in ATP. Importantly, the diagram also shows why oxygen is indispensable for maximal ATP yield: it serves as the terminal electron acceptor in the ETC, without which electrons would back up and oxidative phosphorylation would halt.
SECTION 4
Thermodynamic & Mechanistic Framework
The energetics of metabolism are governed by the Gibbs free energy equation, which allows us to predict the direction and magnitude of biochemical reactions. Understanding how ΔG, ΔG°', and the relationship between enthalpy, entropy, and temperature determine reaction spontaneity is critical for interpreting metabolic pathways at the AP Biology level.
GIBBS FREE ENERGY CHANGE
Where ΔG = change in Gibbs free energy (kJ/mol), ΔH = change in enthalpy, T = absolute temperature (K), ΔS = change in entropy. A negative ΔG indicates a thermodynamically favorable (exergonic) reaction.
ATP HYDROLYSIS
Under cellular conditions the actual ΔG is often −54 kJ/mol because ATP is maintained at concentrations far above equilibrium. This large negative ΔG makes ATP hydrolysis a potent driver of otherwise endergonic reactions when the two are coupled.
GLUCOSE OXIDATION (OVERALL)
The complete oxidation of one mole of glucose releases 2,870 kJ. Of this, approximately 40% is captured in ~30–32 ATP molecules (each storing ~30.5 kJ in the phosphoanhydride bond), while the remainder is dissipated as heat — an impressively high efficiency compared to most human-engineered combustion engines.
Energy Coupling in Practice
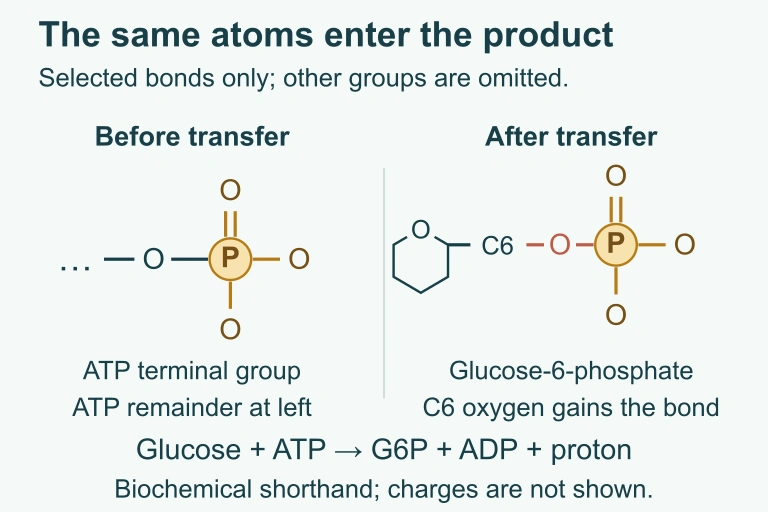
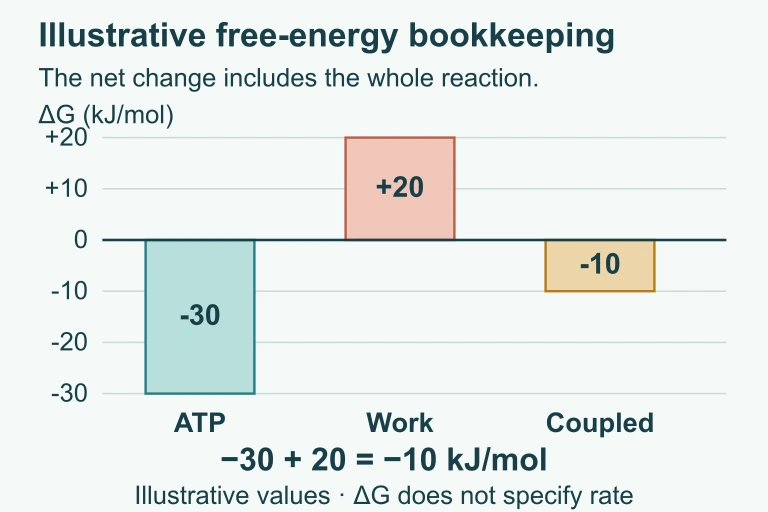
The concept of energy coupling is central to cellular energetics. Consider a hypothetical endergonic reaction with ΔG = +14 kJ/mol. If the cell couples this reaction to ATP hydrolysis (ΔG = −30.5 kJ/mol), the net ΔG becomes −16.5 kJ/mol — the combined process is now exergonic and proceeds spontaneously. In biochemistry, this coupling is usually achieved through a shared phosphorylated intermediate: ATP phosphorylates a substrate, making it more reactive, and the subsequent reaction proceeds with a net release of free energy. Enzymes facilitate this by binding both ATP and the substrate in their active site, ensuring the two half-reactions occur in concert rather than independently.
 Selected atom map
 Illustrative free-energy bookkeeping
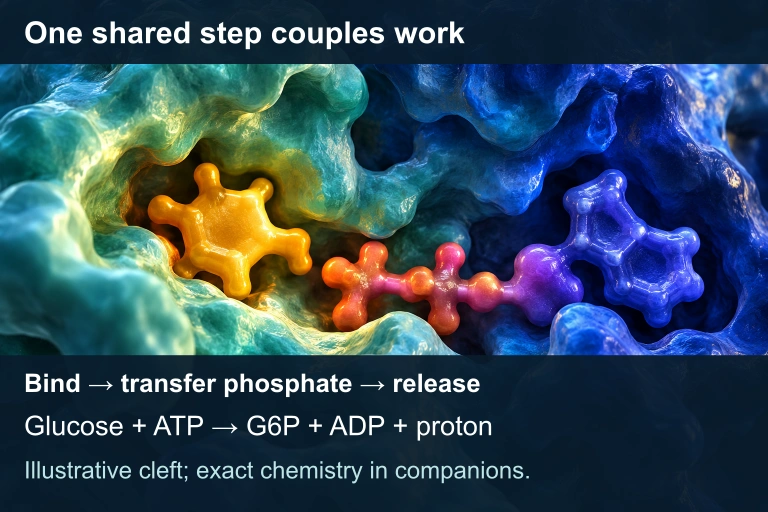 Hexokinase couples glucose phosphorylation to ATP chemistry by transferring the same terminal phosphoryl group in a shared enzyme-mediated step. ATP becomes ADP and glucose becomes glucose-6-phosphate; the enzyme is regenerated. In the illustrative ledger, −30 + 20 = −10 kJ/mol. Breaking a bond alone costs energy, and the sign of ΔG does not specify reaction speed.
AP EXAM TIP
SECTION 5
Detailed Pathway Breakdown
To fully appreciate cellular energy conversion, we must examine each major pathway in detail. The diagram below illustrates the electron transport chain and chemiosmosis — the stage responsible for the vast majority of ATP production. Following the diagram, a comprehensive table summarizes the inputs, outputs, and locations of every major stage.
| Stage | Location | Inputs (per glucose) | Outputs (per glucose) | ATP Produced |
|---|---|---|---|---|
| Glycolysis | Cytoplasm | 1 Glucose, 2 ATP, 2 NAD⁺ | 2 Pyruvate, 2 NADH, 2 H₂O | 4 (net 2) |
| Pyruvate Oxidation | Mitochondrial matrix | 2 Pyruvate, 2 NAD⁺, 2 CoA | 2 Acetyl-CoA, 2 NADH, 2 CO₂ | 0 |
| Citric Acid Cycle | Mitochondrial matrix | 2 Acetyl-CoA, 6 NAD⁺, 2 FAD, 2 GDP | 4 CO₂, 6 NADH, 2 FADH₂, 2 GTP | 2 (as GTP) |
| Oxidative Phosphorylation | Inner mitochondrial membrane | 10 NADH, 2 FADH₂, 6 O₂ | 6 H₂O, NAD⁺, FAD recycled | ~26–28 |
| TOTAL | — | — | 6 CO₂, 6 H₂O | ~30–32 |
Inputs, outputs, and ATP yield for each stage of aerobic cellular respiration (per molecule of glucose)
When oxygen is unavailable, cells rely on fermentation — either lactic acid fermentation (in animal muscle cells and certain bacteria) or alcohol fermentation (in yeast and some plant cells). Fermentation does not produce additional ATP beyond the net 2 ATP from glycolysis, but it is essential because it regenerates NAD⁺ from NADH, allowing glycolysis to continue. Without this recycling, the cell's limited pool of NAD⁺ would be entirely reduced, and glycolysis — the sole source of ATP under anaerobic conditions — would grind to a halt.
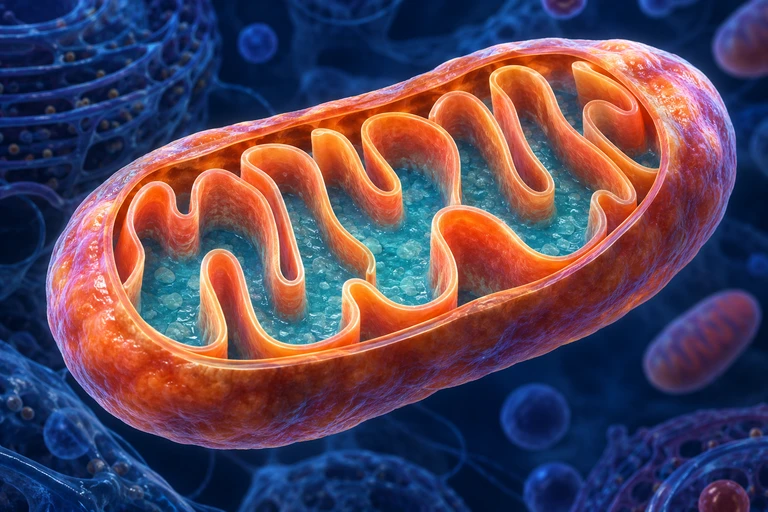 The folded inner mitochondrial membrane separates the matrix from the intermembrane space and provides the surface for oxidative phosphorylation.
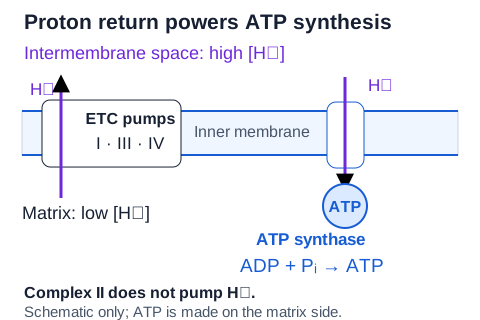 Complexes I, III and IV pump protons from the matrix into the intermembrane space. Proton return through ATP synthase drives ATP production on the matrix side; Complex II does not pump protons.Open full diagram
SECTION 6
Worked Example: ATP Accounting
A common AP Biology question asks you to calculate the theoretical maximum ATP yield from the complete aerobic oxidation of one glucose molecule and to determine the efficiency of energy capture. Let's walk through this systematically.
Calculating Maximum ATP Yield and Efficiency
- 1
Step 1 — Tally Electron Carriers
Sum all NADH and FADH₂ produced per glucose across every stage. Glycolysis: 2 NADH. Pyruvate oxidation: 2 NADH. Citric acid cycle (×2 turns): 6 NADH + 2 FADH₂. Total: 10 NADH + 2 FADH₂.10 NADH + 2 FADH₂ - 2
Step 2 — Convert to ATP via Oxidative Phosphorylation
Each NADH yields approximately 2.5 ATP (passing electrons to Complex I, which pumps more H⁺). Each FADH₂ yields approximately 1.5 ATP (entering at Complex II, bypassing the Complex I proton pump). Therefore: 10 × 2.5 = 25 ATP from NADH, and 2 × 1.5 = 3 ATP from FADH₂.25 + 3 = 28 ATP from oxidative phosphorylation - 3
Step 3 — Add Substrate-Level Phosphorylation
Glycolysis contributes a net 2 ATP via substrate-level phosphorylation. The citric acid cycle produces 2 GTP (equivalent to 2 ATP) via substrate-level phosphorylation. Adding these to the oxidative phosphorylation yield gives the total.28 + 2 + 2 = 32 ATP (maximum theoretical yield) - 4
Step 4 — Consider the NADH Shuttle Variation
The 2 NADH produced in the cytoplasm during glycolysis must be shuttled into the mitochondria. If the malate-aspartate shuttle is used, each yields 2.5 ATP (total stays 32). If the glycerol-3-phosphate shuttle is used (as in some cell types), each yields only 1.5 ATP, reducing the total by 2 ATP to approximately 30.Practical range: ~30–32 ATP per glucose - 5
Step 5 — Calculate Efficiency
Taking 32 ATP as the maximum: Energy captured = 32 × 30.5 kJ/mol = 976 kJ. Total free energy available from glucose oxidation = 2,870 kJ/mol. Efficiency = (976 ÷ 2,870) × 100% ≈ 34%. Under actual cellular conditions (where ΔG for ATP hydrolysis is closer to −54 kJ/mol), the effective efficiency can reach approximately 60%, well above that of a typical automobile engine (~25%).≈34% (standard conditions) to ≈60% (cellular conditions)
SECTION 7
Aerobic vs. Anaerobic Metabolism
Organisms and even individual tissues within the same organism switch between aerobic and anaerobic metabolic strategies depending on oxygen availability and energy demand. Comparing these two modes highlights the evolutionary tradeoffs between ATP yield and speed of production, and underscores why multicellular organisms invested in elaborate oxygen-delivery systems like circulatory and respiratory networks.
| Feature | Aerobic Respiration | Anaerobic Fermentation |
|---|---|---|
| O₂ Requirement | Required as terminal electron acceptor | Not required |
| ATP Yield / Glucose | ~30–32 ATP | 2 ATP (net from glycolysis only) |
| Speed | Slower (many enzymatic steps) | Faster (fewer steps) |
| End Products | CO₂ and H₂O | Ethanol + CO₂ (yeast) or Lactate (muscle) |
| NAD⁺ Regeneration | Via ETC (NADH donates e⁻ to O₂) | Via reduction of pyruvate (to lactate or ethanol) |
| Primary Role of NAD⁺ Recycling | Feeds electrons into oxidative phosphorylation for maximum ATP | Keeps glycolysis running when O₂ is absent |
| Biological Examples | Most eukaryotic cells, obligate aerobes | Yeast (ethanol), skeletal muscle during intense exercise (lactate) |
Comparison of aerobic respiration and anaerobic fermentation
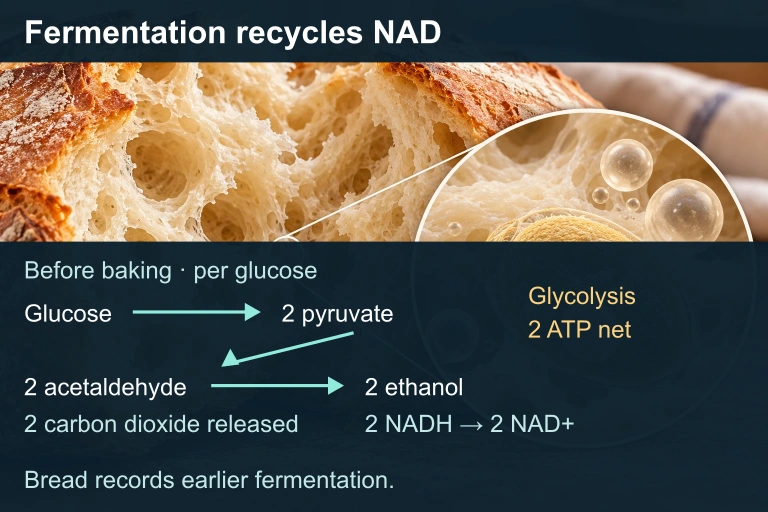 Yeast fermentation in dough releases CO₂ and regenerates NAD⁺ before baking. The baked crumb records earlier gas formation; living or actively fermenting yeast in finished bread is not implied. Net two ATP per glucose arise in glycolysis.
KEY TAKEAWAY
SECTION 8
Connections to Photosynthesis & Advanced Topics
Cellular respiration does not exist in isolation — it is one half of a grand energetic cycle that includes photosynthesis. In autotrophs, the light reactions and Calvin cycle convert solar energy into glucose and O₂, which heterotrophs then consume and oxidize back to CO₂ and H₂O through cellular respiration. Both processes rely on chemiosmosis (a proton gradient driving ATP synthase), but they operate across different membranes and in opposite directions. This conceptual symmetry is a high-yield topic on the AP Biology exam.
| Feature | Cellular Respiration | Photosynthesis |
|---|---|---|
| Overall Equation | C₆H₁₂O₆ + 6O₂ → 6CO₂ + 6H₂O + ATP | 6CO₂ + 6H₂O + light → C₆H₁₂O₆ + 6O₂ |
| Energy Source | Chemical energy in organic molecules | Solar radiation (photons) |
| Organelle | Mitochondria | Chloroplasts |
| Electron Carriers | NADH, FADH₂ | NADPH |
| Chemiosmotic Membrane | Inner mitochondrial membrane | Thylakoid membrane |
| H⁺ Gradient Direction | Matrix → intermembrane space | Stroma → thylakoid lumen |
| Redox Direction | Glucose oxidized, O₂ reduced | H₂O oxidized, CO₂ reduced |
Comparison of cellular respiration and photosynthesis
Beyond the AP curriculum, the study of cellular energetics extends into systems biology and metabolic engineering. Researchers now use flux balance analysis to model entire metabolic networks, and synthetic biologists reprogram microbial metabolic pathways to produce biofuels, pharmaceuticals, and industrial chemicals. Understanding the thermodynamic and kinetic constraints covered in this lesson provides the foundation for these advanced applications. On the AP exam itself, expect questions that require you to connect energetics to evolution (e.g., why might obligate anaerobes have persisted despite the apparent superiority of aerobic respiration?) and to ecology (e.g., energy transfer between trophic levels reflects the same second-law inefficiency seen at the cellular level).
SECTION 9
Practice Problems
Question 1: CONCEPTUAL
- A. Glycolysis ceases because the cell runs out of glucose.
- B. The proton gradient across the inner mitochondrial membrane increases because H⁺ can no longer flow back through ATP synthase.
- C. NADH production in the citric acid cycle immediately stops.
- D. Oxygen consumption at Complex IV increases dramatically.
Show answer (B)
Question 2: BASIC CALCULATION
- A. 12 ATP
- B. 24 ATP
- C. 48 ATP
- D. 384 ATP
Show answer (B)
Question 3: INTERMEDIATE
- A. NADH levels will decrease because the citric acid cycle accelerates to compensate for lost ATP production.
- B. NADH levels will remain unchanged because NADH is produced independently of the electron transport chain.
- C. NADH levels will increase because electrons can no longer be passed to oxygen, blocking the reoxidation of NADH to NAD⁺ at Complex I.
- D. NADH levels will fluctuate cyclically as the cell alternates between aerobic and anaerobic pathways.
Show answer (C)
Question 4: APPLIED
4 ptsShow answer
Question 5: CRITICAL THINKING
4 ptsShow answer
SUMMARY
Cellular Energy — Summary
Summary
Cellular energy metabolism is the process by which cells convert the chemical energy in organic molecules into ATP, the universal energy currency that powers virtually all cellular work. The complete aerobic oxidation of glucose proceeds through four interconnected stages: glycolysis (cytoplasm, net 2 ATP), pyruvate oxidation (mitochondrial matrix), the citric acid cycle (mitochondrial matrix, 2 GTP + electron carriers), and oxidative phosphorylation (inner mitochondrial membrane, ~26–28 ATP). The electron carriers NADH and FADH₂ shuttle electrons to the electron transport chain, where stepwise electron transfer drives proton pumping and establishes the proton motive force that powers ATP synthase via chemiosmosis.
When oxygen is unavailable, cells turn to fermentation (lactic acid or alcohol) not to produce additional ATP, but to regenerate NAD⁺ so that glycolysis can continue. The thermodynamic framework of Gibbs free energy (ΔG) governs every step: cells harness exergonic reactions to drive endergonic ones through energy coupling, and allosteric regulation of key enzymes like phosphofructokinase ensures metabolic flux matches demand. Cellular respiration and photosynthesis are complementary processes that together cycle carbon and energy through the biosphere, both relying on chemiosmosis but operating across different membranes in opposite redox directions.