

SECTION 1
Historical Context & Motivation
The question of why organisms are composed of trillions of tiny cells rather than a few enormous ones has fascinated biologists since the invention of the microscope. When Robert Hooke first coined the term "cell" in 1665, he could not have predicted that the diminutive scale he observed was not merely an accident of nature but a physical necessity. Over the following centuries, advances in microscopy and mathematical biology revealed that cell size is constrained by the laws of geometry and diffusion, making the surface-area-to-volume ratio one of the most consequential relationships in all of cell biology.
1665 • Hooke Observes Cells
1838 • Cell Theory Formalized
1855 • Fick's Laws of Diffusion
1900s • SA:V Ratio Recognized
These historical developments converge on a central question: what physical and biological constraints prevent cells from growing indefinitely? Answering this question requires understanding how geometry, diffusion, and membrane transport interact to set an upper bound on cell dimensions.
SECTION 2
Core Principles of Cell Size
Cell size is governed by several interrelated physical and biological principles. A cell's plasma membrane serves as its interface with the external environment, and all exchange of nutrients, gases, and wastes must occur across this surface. Meanwhile, the cytoplasmic volume houses the metabolic machinery that demands those resources. As a cell grows, its volume increases far more rapidly than its surface area, creating a fundamental mismatch between supply capacity and metabolic demand.
Surface-Area-to-Volume Ratio
Diffusion Constraints
Metabolic Demand
Genome-to-Cytoplasm Ratio
SECTION 3
Visualizing the SA:V Relationship
The diagram above demonstrates the core geometric constraint on cell size. A cube with side length 1 cm has a SA:V ratio of 6, meaning every unit of volume is generously served by membrane surface. Triple the side length to 3 cm and the ratio plummets to 2; at 5 cm it falls to 1.2. Because real cells are roughly spherical—a geometry that actually minimizes surface area for a given volume—the constraint is even more severe than the cubic model suggests. Cells that must maintain high metabolic rates, such as neurons and intestinal epithelial cells, often adopt elongated or folded morphologies that increase surface area without proportionally increasing volume.
SECTION 4
Mathematical Framework
Understanding cell size quantitatively requires calculating surface area and volume for idealized geometries and then examining how their ratio changes with scale. Although real cells are irregular, the sphere is the most useful model because it represents the shape that maximizes volume for a given surface area—the default geometry a fluid-filled membrane would assume in the absence of cytoskeletal constraints.
SURFACE AREA OF A SPHERE
where r is the radius of the cell. Surface area scales with the square of the radius.
VOLUME OF A SPHERE
Volume scales with the cube of the radius, outpacing surface area as the cell grows.
SA:V RATIO FOR A SPHERE
The ratio simplifies to 3/r. As r increases, SA:V decreases hyperbolically, confirming that larger cells have proportionally less membrane per unit cytoplasm.
DIFFUSION TIME
where x is the distance and D is the diffusion coefficient. Time scales with the square of distance, making diffusion impractical beyond ~100 µm in aqueous cytoplasm.
Key takeaway
SECTION 5
Cellular Adaptations to Size Constraints
Evolution has produced numerous structural solutions that allow certain cells to circumvent the basic SA:V constraint. These adaptations either increase effective surface area, reduce effective diffusion distance, or boost genomic control over a larger cytoplasmic volume. Understanding these adaptations is critical for the AP exam because they demonstrate how natural selection acts on physical constraints.
| Adaptation | Example Cell | Mechanism |
|---|---|---|
| Microvilli | Intestinal epithelium | Finger-like projections increase absorptive SA up to 600-fold |
| Flattened / biconcave disc | Red blood cell (erythrocyte) | Thin profile minimizes O₂ diffusion distance to ~1 µm |
| Internal membranes (ER, mitochondria) | Eukaryotes generally | Endomembrane system increases total membrane area for reactions |
| Multinucleation | Skeletal muscle fibers | Multiple nuclei regulate gene expression across large cytoplasmic volume |
| Cytoplasmic streaming | Plant cells (e.g., Elodea) | Motor-driven circulation of cytoplasm reduces reliance on diffusion alone |
Common adaptations to the SA:V constraint
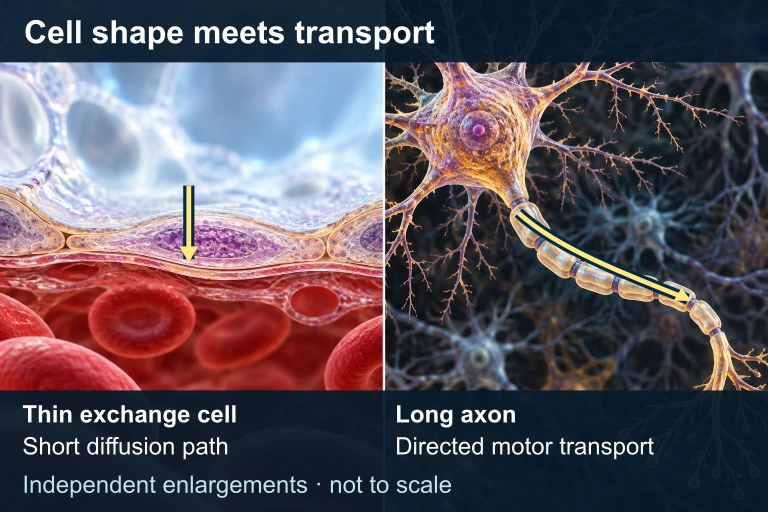 A thin exchange surface shortens a diffusion path. A long neuron uses directed transport along its axon as well as local diffusion; the enlargements have independent scales.
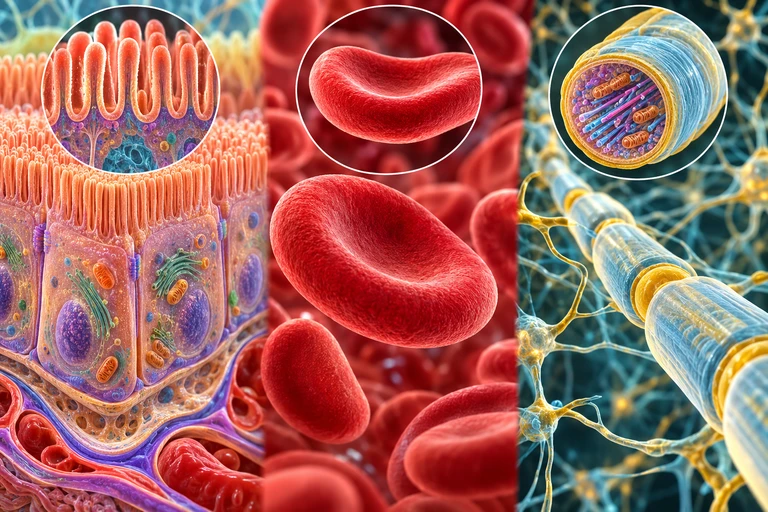 Microvilli increase exchange area, a biconcave shape shortens diffusion paths, and a thin axon limits radial diffusion distance while relying on active transport along its length.
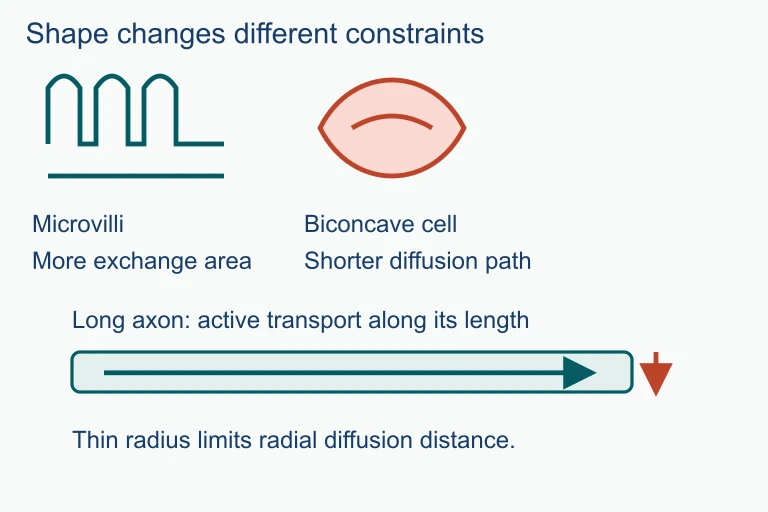 Microvilli increase exchange area, a biconcave shape shortens diffusion paths, and a thin axon limits radial diffusion distance while relying on active transport along its length.
SECTION 6
Worked Example: Comparing Two Cells
Consider two spherical cells: Cell A has a radius of 5 µm and Cell B has a radius of 20 µm. Calculate the SA:V ratio for each and determine how many times more efficiently Cell A can exchange materials relative to its volume.
Worked example
- 1
Step 1 — Identify Given Values
Cell A: rA = 5 µm. Cell B: rB = 20 µm. We need SA:V = 3/r for each sphere. - 2
Step 2 — Calculate SA:V for Cell A
SA:VA = 3 / 5 µm = 0.6 µm⁻¹. Alternatively: SA = 4π(5)² = 100π µm² ≈ 314 µm², V = (4/3)π(5)³ ≈ 524 µm³, ratio ≈ 314/524 ≈ 0.6 µm⁻¹.SA:V for Cell A = 0.6 µm⁻¹ - 3
Step 3 — Calculate SA:V for Cell B
SA:VB = 3 / 20 µm = 0.15 µm⁻¹. Full calculation: SA = 4π(20)² = 1600π ≈ 5027 µm², V = (4/3)π(20)³ ≈ 33,510 µm³, ratio ≈ 5027/33510 ≈ 0.15 µm⁻¹.SA:V for Cell B = 0.15 µm⁻¹ - 4
Step 4 — Compare Exchange Efficiency
Ratio of efficiencies: 0.6 / 0.15 = 4. Cell A has a SA:V ratio four times greater than Cell B, meaning each cubic micrometer of Cell A's cytoplasm is served by four times more membrane surface than Cell B's.Cell A exchanges materials 4× more efficiently per unit volume - 5
Step 5 — Biological Implication
Cell B would need to adopt adaptations—such as internal membrane compartments, active transport proteins, or a flattened morphology—to compensate for its lower SA:V ratio. Without such adaptations, the interior of Cell B would experience oxygen and nutrient deficits.
SECTION 7
Advantages & Limitations of Small Cell Size
While small cell size is overwhelmingly advantageous for exchange efficiency, it does impose biological trade-offs. Understanding both sides of this constraint helps explain why cell size varies across taxa and why some organisms have evolved exceptionally large cells despite the geometric penalty.
| Advantages of Small Size | Limitations of Small Size |
|---|---|
| High SA:V ratio enables rapid nutrient uptake and waste removal | Limited space for organelles and storage molecules |
| Short diffusion distances ensure fast intracellular transport | Cannot maintain large-scale intracellular organization without compartments |
| Efficient heat dissipation prevents thermal damage | More susceptible to environmental perturbations (osmotic stress) |
| Rapid cell division supports growth and repair | Lower absolute capacity for biosynthesis per cell |
Trade-offs associated with maintaining small cell size
Key takeaway
SECTION 8
Connection to Cell Division & Organismal Organization
The SA:V constraint does not merely limit how large a cell can grow—it provides the fundamental evolutionary pressure that drove the development of cell division, multicellularity, and tissue-level specialization. When a cell reaches a critical size threshold, the declining SA:V ratio triggers signaling pathways that initiate mitosis, restoring two daughter cells with optimal ratios. At the organismal level, multicellularity allows billions of small, efficient cells to collectively form large organisms while each individual cell maintains favorable exchange geometry.
| Concept | Cell Size Connection | AP Biology Unit |
|---|---|---|
| Mitosis & the Cell Cycle | Declining SA:V is a key trigger for cell division; G₁ checkpoint monitors cell size | Unit 4 |
| Membrane Transport | Active and passive transport rates are constrained by available membrane area | Unit 2 |
| Cellular Respiration | O₂ diffusion to mitochondria is distance-limited; small cells ensure adequate delivery | Unit 3 |
| Evolution of Eukaryotes | Internal membranes (endosymbiosis) permitted larger cell sizes by increasing total membrane area | Unit 7 |
| Organismal Body Plans | Tissues like alveoli and villi maximize SA at the organ level, mirroring the cellular constraint | Unit 8 |
How cell size connects to other AP Biology topics
Looking forward, the principles of SA:V scaling reappear in ecology (Bergmann's rule relating body size to thermoregulation), physiology (lung and intestinal surface area maximization), and even bioengineering (designing artificial tissues with adequate diffusion). Mastering the cell size concept builds a foundation for understanding scaling phenomena at every level of biological organization.
SECTION 9
Practice Problems
Question 1: CONCEPTUAL
- A. A single large cell cannot contain enough DNA to regulate its entire volume.
- B. Membrane fluidity decreases in larger cells, preventing signal transduction.
- C. The decreasing SA:V ratio in larger cells limits the rate of nutrient and gas exchange relative to metabolic demand.
- D. Large cells collapse under their own weight because the cytoskeleton cannot support the increased volume.
Show answer (C)
Question 2: BASIC CALCULATION
- A. 1.5 µm⁻¹
- B. 3.0 µm⁻¹
- C. 6.0 µm⁻¹
- D. 4π µm⁻¹
Show answer (B)
Question 3: INTERMEDIATE
- A. Volume increases 16×; surface area increases 64×
- B. Volume increases 4×; surface area increases 4×
- C. Volume increases 16×; surface area increases 64×
- D. Volume increases 64×; surface area increases 16×
Show answer (D)
Question 4: APPLIED
Show answer
Question 5: CRITICAL THINKING