
SECTION 1
Historical Context & Motivation
The idea that living organisms are composed of cells—and that new cells arise only from pre-existing cells—was one of the most transformative insights in the history of biology. Before microscopists could observe chromosomes condensing and separating, the mechanism by which organisms grow, repair tissues, and reproduce asexually remained a profound mystery. The elucidation of the cell cycle emerged gradually over nearly two centuries, driven by improvements in microscopy, biochemistry, and ultimately molecular genetics. Understanding the historical arc of these discoveries reveals not only how the field advanced but also why precise regulation of cell division is central to multicellular life—and what goes wrong in diseases such as cancer.
1855 • Omnis cellula e cellula
1882 • Walther Flemming Describes Mitosis
1951 • HeLa Cells & Continuous Culture
1970s • Discovery of Cyclins and CDKs
1989 • Tumor Suppressors and Oncogenes
These milestones converge on a central question that the AP Biology curriculum asks you to address: How do cells coordinate DNA replication, growth, and division with internal and external signals to maintain genomic integrity? Answering this question requires an integrated understanding of cell cycle phases, checkpoint mechanisms, and the molecular machinery that ensures faithful transmission of genetic information.
SECTION 2
Core Principles of the Cell Cycle
The cell cycle is an ordered series of events that culminates in cell growth and division into two daughter cells. It is conventionally divided into two major stages: interphase (during which the cell grows and duplicates its DNA) and the mitotic (M) phase (during which the duplicated chromosomes are separated and the cell physically divides). Several core principles govern how cells traverse this cycle, ensuring accuracy, coordination, and responsiveness to environmental cues.
Ordered Progression
Checkpoint Surveillance
Cyclin–CDK Regulation
Signal Integration
Faithful Genome Transmission
KEY TAKEAWAY
SECTION 3
Visual Overview of the Cell Cycle
The cell cycle is most commonly depicted as a circular diagram reflecting its cyclical nature. The relative size of each sector represents the approximate proportion of time a typical rapidly dividing mammalian cell spends in each phase. Interphase dominates the cycle, occupying roughly 90% of total cycle time, while the mitotic phase—though dramatic in its chromosome movements—is comparatively brief. The diagram below illustrates the four main phases along with the three principal checkpoints that regulate progression.
Notice that interphase (G₁ + S + G₂) accounts for approximately 90% of a typical 24-hour mammalian cell cycle. During G₁, the cell grows in size, synthesizes proteins, and monitors extracellular signals that determine whether it should commit to division. The restriction point in late G₁ is a pivotal commitment event: once a cell passes this point, it becomes largely independent of external mitogens and proceeds through S, G₂, and M. Cells that do not receive sufficient growth factor stimulation enter G₀, a quiescent state from which some cell types (such as neurons and mature skeletal muscle fibers) rarely return, while others (such as hepatocytes) can be stimulated to re-enter the cycle.
SECTION 4
Molecular Machinery — Cyclins, CDKs, and Checkpoints
Progression through the cell cycle is driven by the oscillating activity of cyclin-dependent kinases (CDKs), enzymes that phosphorylate target proteins only when bound to their regulatory cyclin partners. Different cyclin–CDK complexes dominate at each phase of the cycle. Cyclin concentrations rise and fall in a predictable pattern—driven by transcriptional activation and targeted proteasomal degradation via ubiquitination—while CDK protein levels remain relatively constant. This oscillation of cyclin abundance creates the molecular 'clock' that times cell cycle transitions.
Key Cyclin–CDK Complexes
| Phase Transition | Cyclin | CDK Partner | Key Function |
|---|---|---|---|
| G₁ progression | Cyclin D | CDK4 / CDK6 | Phosphorylates Rb, releasing E2F transcription factors to drive S-phase gene expression |
| G₁ → S transition | Cyclin E | CDK2 | Initiates DNA replication origin licensing and centrosome duplication |
| S phase | Cyclin A | CDK2 | Sustains replication fork progression; prevents re-replication |
| G₂ → M transition | Cyclin B | CDK1 (Cdc2) | Also called MPF (maturation promoting factor); triggers chromosome condensation, nuclear envelope breakdown, spindle assembly |
Major cyclin–CDK complexes and their roles in cell cycle progression
Checkpoint Mechanisms
Checkpoints are signal transduction pathways that monitor the integrity of critical cell cycle events and can arrest progression when errors are detected. The G₁ checkpoint (restriction point in mammals) assesses cell size, nutrient availability, growth factor signals, and DNA damage. A key effector is the tumor suppressor p53, which, upon detecting DNA damage, activates transcription of p21—a CDK inhibitor that blocks Cyclin E–CDK2 activity. The G₂ checkpoint verifies that DNA replication is complete and undamaged before permitting entry into mitosis. Finally, the spindle assembly checkpoint (SAC) ensures that all kinetochores are properly attached to spindle microtubules before anaphase begins; unattached kinetochores generate a 'wait' signal by sequestering APC/C activators, preventing the degradation of securin and the premature separation of sister chromatids.
AP EXAM TIP
SECTION 5
Mitosis and Cytokinesis — Detailed Breakdown
The M phase comprises two overlapping processes: mitosis (nuclear division) and cytokinesis (cytoplasmic division). Mitosis is subdivided into five stages—prophase, prometaphase, metaphase, anaphase, and telophase—each characterized by specific chromosomal and cytoskeletal events. While textbooks often present these as discrete steps, they form a continuous morphological progression driven by the activity of Cyclin B–CDK1 and its downstream targets.
During prophase, chromatin fibers condense into discrete, visible chromosomes, each consisting of two sister chromatids joined at the centromere. The mitotic spindle begins to form as centrosomes move toward opposite poles. In prometaphase, the nuclear envelope disassembles into fragments, and kinetochore microtubules from opposite poles attach to the kinetochore protein complexes assembled on each centromere. Metaphase is defined by the alignment of all chromosomes along the metaphase plate (the cell's equator), a configuration verified by the spindle assembly checkpoint. Anaphase begins when the enzyme separase cleaves cohesin proteins holding sister chromatids together; motor proteins and microtubule depolymerization then pull each chromatid toward its respective pole. During telophase, chromosomes decondense and nuclear envelopes re-form around each chromosome set. Cytokinesis occurs concurrently or slightly after telophase: in animal cells, a contractile ring of actin and myosin filaments pinches the cell in two at the cleavage furrow, while in plant cells, vesicles fuse to form a cell plate that matures into a new cell wall.
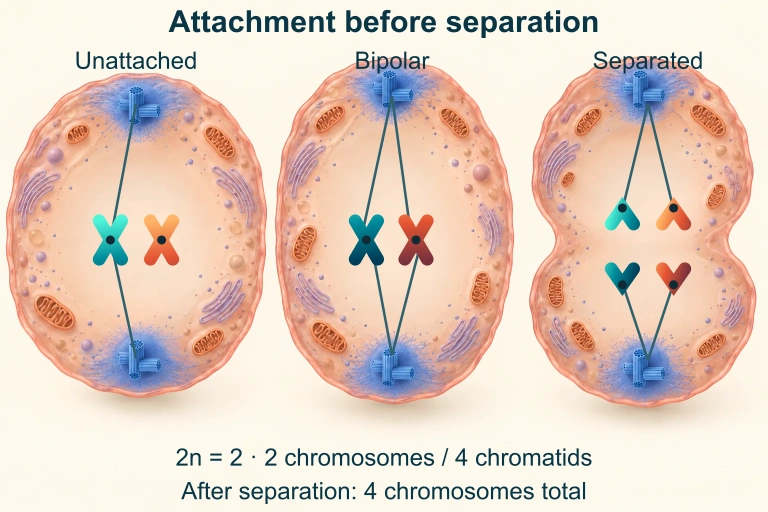 In this 2 n = 2 mitotic model, sister kinetochores attach to opposite poles before separation. Once sisters separate, each former chromatid counts as a chromosome.
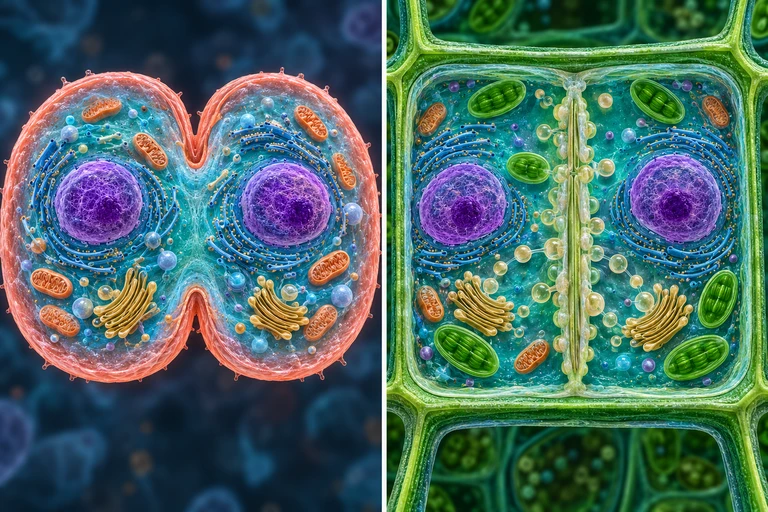 Animal cytokinesis constricts inward through an actomyosin ring. In plant cells, Golgi-derived vesicles build a central cell plate that expands outward and joins the parental boundary.
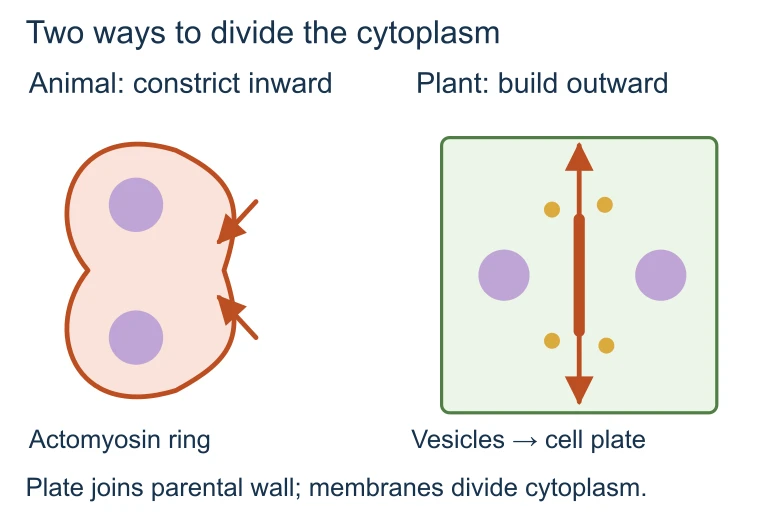 Animal cytokinesis constricts inward through an actomyosin ring. In plant cells, Golgi-derived vesicles build a central cell plate that expands outward and joins the parental boundary.
SECTION 6
Worked Example — Analyzing the Mitotic Index
A common quantitative application of cell cycle knowledge involves calculating the mitotic index—the fraction of cells in a population that are undergoing mitosis at a given time. This value provides an estimate of the relative length of M phase and can indicate the proliferative activity of a tissue, making it a useful diagnostic tool in cancer biology.
MITOTIC INDEX
A higher mitotic index indicates a greater proportion of cells actively dividing. Tumor tissues typically have higher mitotic indices than normal tissues.
Determining the Mitotic Index and Estimating Phase Duration
- 1
Step 1 — State the Problem
A student examines an onion root tip slide and counts 200 cells total. Of these, 120 are in interphase, 20 are in prophase, 10 in prometaphase, 25 in metaphase, 15 in anaphase, and 10 in telophase. The total cell cycle time for this tissue is 24 hours. Calculate the mitotic index and estimate the duration of each mitotic stage. - 2
Step 2 — Calculate the Mitotic Index
Cells in mitosis = 20 + 10 + 25 + 15 + 10 = 80 cells. Total cells = 200. Mitotic Index = (80 ÷ 200) × 100%Mitotic Index = 40% - 3
Step 3 — Estimate Time in Each Phase
Assuming cells are randomly distributed across the cycle (an asynchronous population), the proportion of cells in a phase approximates the fraction of the cycle spent in that phase. Time in phase = (cells in that phase ÷ total cells) × total cycle time. - 4
Step 4 — Compute Phase Durations
Interphase: (120 ÷ 200) × 24 h = 14.4 h. Prophase: (20 ÷ 200) × 24 h = 2.4 h. Prometaphase: (10 ÷ 200) × 24 h = 1.2 h. Metaphase: (25 ÷ 200) × 24 h = 3.0 h. Anaphase: (15 ÷ 200) × 24 h = 1.8 h. Telophase: (10 ÷ 200) × 24 h = 1.2 h.Total M phase ≈ 9.6 h; Interphase ≈ 14.4 h - 5
Step 5 — Interpret the Results
A mitotic index of 40% is unusually high for most normal tissues (typical values are 1–5%), suggesting either a very rapidly dividing tissue or that the root tip meristem was sampled at a region of maximal proliferative activity. On the AP exam, an elevated mitotic index in a clinical context would suggest cancerous or rapidly regenerating tissue.
SECTION 7
Cell Cycle Regulation and Cancer
Cancer is fundamentally a disease of cell cycle deregulation. Normal cells require multiple mutations—typically affecting both growth-promoting proto-oncogenes and growth-inhibiting tumor suppressor genes—before they can proliferate without limit. Understanding the distinction between these two classes of regulatory genes is essential for the AP Biology exam and for appreciating how targeted cancer therapies work.
| Feature | Proto-Oncogenes / Oncogenes | Tumor Suppressor Genes |
|---|---|---|
| Normal function | Encode proteins that promote cell growth and division (growth factors, receptors, signal transduction proteins, transcription factors) | Encode proteins that inhibit cell division, promote apoptosis, or repair DNA damage (p53, Rb, BRCA1) |
| Mutation type | Gain-of-function (dominant): a single mutant allele can drive proliferation | Loss-of-function (recessive): typically both alleles must be inactivated (Knudson's two-hit hypothesis) |
| Analogy | A stuck accelerator pedal—the growth signal is always 'on' | Broken brake pedal—the cell cannot stop dividing even when signals say 'halt' |
| Examples | Ras (GTPase stuck in active form), HER2 (overexpressed receptor), Myc (transcription factor amplified) | p53 (guardian of the genome), Rb (gatekeeper of G₁), APC (Wnt pathway regulator) |
| Therapeutic target | Kinase inhibitors (e.g., imatinib for BCR-ABL), monoclonal antibodies (e.g., trastuzumab for HER2) | Harder to target directly; strategies include restoring function or exploiting synthetic lethality |
Comparison of oncogenes and tumor suppressors in cancer biology
KEY TAKEAWAY
SECTION 8
Connections to Meiosis and Advanced Topics
While the cell cycle as discussed in this lesson focuses on mitotic division—producing genetically identical daughter cells—many of the same molecular players (CDKs, cohesins, spindle apparatus) also operate during meiosis, the specialized division that produces haploid gametes. Understanding the parallels and differences between mitosis and meiosis is crucial for connecting the cell cycle unit to genetics and heredity. The table below highlights these distinctions.
| Feature | Mitosis | Meiosis |
|---|---|---|
| Number of divisions | One | Two (meiosis I and meiosis II) |
| Daughter cells produced | 2 diploid (2n) cells | 4 haploid (n) cells |
| Genetic outcome | Genetically identical to parent | Genetically unique (crossing over + independent assortment) |
| Synapsis / crossing over | Does not occur | Occurs in prophase I; chiasmata form between homologs |
| Biological role | Growth, repair, asexual reproduction | Production of gametes; generates genetic diversity |
| Separation events | Sister chromatids separate (anaphase) | Homologs separate (anaphase I); sister chromatids separate (anaphase II) |
Mitosis vs. Meiosis — key distinctions tested on the AP exam
Looking ahead, advanced coursework in cell biology explores topics such as cell cycle-dependent transcriptional programs revealed by single-cell RNA sequencing, the role of CDK inhibitors as therapeutic agents (e.g., palbociclib, a CDK4/6 inhibitor used in breast cancer treatment), and the emerging understanding of how cellular senescence—a permanent cell cycle arrest—contributes to aging and age-related disease. The foundational knowledge you build here in understanding cyclin–CDK regulation and checkpoint logic will serve as the scaffold for all of these advanced concepts.
SECTION 9
Practice Problems
Question 1: CONCEPTUAL
- A. Cells will arrest in G₁ because cyclin B is required for the G₁ checkpoint.
- B. Cells will proceed through mitosis more rapidly because CDK1 remains constitutively active.
- C. Cells will arrest in mitosis because the inactivation of cyclin B–CDK1 is required for mitotic exit.
- D. Cells will skip S phase and enter mitosis directly from G₁.
Show answer (C)
Question 2: BASIC CALCULATION
- A. 0.6 hours
- B. 1.2 hours
- C. 3.0 hours
- D. 6.0 hours
Show answer (B)
Question 3: INTERMEDIATE
- A. Without functional Rb, E2F transcription factors are constitutively active, driving expression of S-phase genes regardless of mitogenic signals.
- B. The Rb mutation causes overexpression of p53, which promotes cell cycle entry.
- C. Without Rb, cyclin B accumulates and drives cells through the G₂/M transition.
- D. Rb normally promotes DNA replication; its loss forces cells into a compensatory division mode.
Show answer (A)
Question 4: APPLIED
4 ptsShow answer
Question 5: CRITICAL THINKING
4 ptsShow answer
SUMMARY
Cell Cycle — Summary Review
Summary
The cell cycle is an ordered sequence of events—G₁, S, G₂, and M phase—by which a cell duplicates its genome and divides into two genetically identical daughter cells. Interphase (G₁ + S + G₂) occupies roughly 90% of the cycle, during which the cell grows, replicates its DNA, and prepares for division. Mitosis proceeds through prophase, prometaphase, metaphase, anaphase, and telophase, culminating in cytokinesis. Progression is driven by cyclin–CDK complexes whose oscillating activity creates molecular switches at each phase transition.
Three major checkpoints—the G₁ checkpoint (restriction point), the G₂ checkpoint, and the spindle assembly checkpoint—ensure DNA integrity and proper chromosome attachment before allowing progression. Tumor suppressor genes (p53, Rb) act as brakes, while proto-oncogenes (Ras, Myc) act as accelerators; mutations disrupting either class can lead to cancer. The mitotic index provides a quantitative measure of proliferative activity and is a common calculation on the AP exam. Cells that exit the cycle enter G₀ (quiescence), where some remain permanently while others can be recalled to active division by mitogenic signals.