
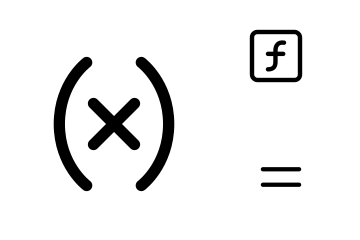
SECTION 1
Historical Context & Motivation
Humans have studied patterns of growth for thousands of years. Ancient farmers tracked linear growth when planting crops in equal rows, and Greek mathematicians explored squares and cubes as they developed geometry. However, it wasn't until the development of algebra and the study of compound interest in the Renaissance that people began to notice a dramatic difference: quantities that multiply over time grow far faster than quantities that merely add. This observation sits at the heart of CCSS.F-LE.3 and is one of the most important ideas in all of mathematics.
~300 BCE • Euclid & Geometric Sequences
1614 • Napier Invents Logarithms
1683 • Jacob Bernoulli & Compound Interest
1798 • Malthus on Population Growth
1965 • Moore's Law
The central question this lesson addresses is deceptively simple: if one quantity grows by repeated addition (like linear or polynomial functions) and another grows by repeated multiplication (like exponential functions), which one eventually dominates? As you'll see through graphs, tables, and algebraic reasoning, the answer is always the exponential—no matter how large the polynomial's degree or coefficients might be.
SECTION 2
Core Principles & Definitions
Before comparing growth types, you need clear definitions of each function family. Every function family has a distinctive structure that determines how fast its outputs increase as the input grows.
Linear Growth
Quadratic Growth
Polynomial Growth
Exponential Growth
The key distinction is between additive growth and multiplicative growth. Linear and polynomial functions grow by adding. Even x¹⁰ is just x multiplied by itself ten times—it's a fixed operation on x. An exponential function like 2ˣ, on the other hand, multiplies a base by itself x times. Because the exponent itself is the variable, the function's output doubles (or triples, etc.) with each step. This repeated multiplication eventually overwhelms any amount of repeated addition.
KEY TAKEAWAY
SECTION 3
Visual Explanation — Growth Comparison Graph
The most powerful way to understand why exponential growth dominates is to see it on a graph. The diagram below plots four functions—linear, quadratic, cubic, and exponential—on the same axes. Pay close attention to where the curves intersect and how the exponential function behaves after those crossover points.
Notice something important in the graph: the exponential curve 2ˣ actually starts out as the slowest function. At x = 5, the linear function 20x already equals 100, while 2⁵ is only 32. But by x = 10, 2¹⁰ = 1,024, which towers over 20(10) = 200. The exponential function doesn't need to start fast—it just needs time. Given enough runway, it will always win.
SECTION 4
Mathematical Framework
To compare growth rates formally, we examine how each function family behaves as x increases. The defining equations reveal why exponential functions eventually dominate.
LINEAR FUNCTION
m = constant rate of change (slope); b = y-intercept. Output increases by a fixed amount m for each unit increase in x.
POLYNOMIAL FUNCTION (DEGREE n)
The highest-power term aₙxⁿ dominates for large x. Growth depends on the degree n: doubling x multiplies the dominant term by 2ⁿ.
EXPONENTIAL FUNCTION
a = initial value; b = constant growth factor. Each unit increase in x multiplies the output by b. The variable is in the exponent, not the base.
Here is the critical insight. Consider the ratio of consecutive outputs for each function type as x increases by 1:
GROWTH RATIO COMPARISON
For linear and polynomial functions, the ratio of consecutive outputs approaches 1 as x grows large—each new output is only slightly larger than the previous one in percentage terms. For an exponential function, the ratio is always exactly b, a constant greater than 1. This constant percentage growth is what makes exponential functions unstoppable.
To put it simply: a polynomial function of degree n grows like x raised to a fixed power. An exponential function grows like a fixed base raised to x. When x is large, having x in the exponent always beats having x in the base. For any polynomial xⁿ and any exponential bˣ (with b > 1), there exists some value of x beyond which bˣ > xⁿ for all larger x.
SECTION 5
Detailed Breakdown — Comparing with Tables
Tables offer another powerful way to observe the crossover. By computing outputs for several values of x, you can see exactly when the exponential overtakes the others. Study the table below carefully and watch for the moment 2ˣ surpasses each competitor.
| x | 20x (Linear) | x² (Quadratic) | x³ (Cubic) | 2ˣ (Exponential) |
|---|---|---|---|---|
| 1 | 20 | 1 | 1 | 2 |
| 2 | 40 | 4 | 8 | 4 |
| 3 | 60 | 9 | 27 | 8 |
| 5 | 100 | 25 | 125 | 32 |
| 8 | 160 | 64 | 512 | 256 |
| 10 | 200 | 100 | 1,000 | 1,024 |
| 15 | 300 | 225 | 3,375 | 32,768 |
| 20 | 400 | 400 | 8,000 | 1,048,576 |
| 30 | 600 | 900 | 27,000 | 1,073,741,824 |
Side-by-side output comparison as x increases
At x = 5, the cubic function x³ = 125 is nearly four times larger than 2⁵ = 32. But by x = 10, the exponential 2¹⁰ = 1,024 has already surpassed the cubic's 1,000. By x = 20, the exponential has exploded to over one million while the cubic sits at only 8,000. And at x = 30, the exponential exceeds one billion—more than 39,000 times the cubic's value. This pattern only becomes more extreme as x continues to grow.
How to Spot the Difference in a Table
SECTION 6
Worked Example — Finding the Crossover
Let's work through a complete problem. Suppose you're comparing the polynomial function f(x) = 5x³ with the exponential function g(x) = 3ˣ. Your task is to determine when the exponential overtakes the polynomial.
When Does 3ˣ Surpass 5x³?
- 1
Step 1 — Set Up a Comparison Table
Calculate both f(x) = 5x³ and g(x) = 3ˣ for several values of x. Start with small values and increase until you see the exponential overtake the polynomial. - 2
Step 2 — Compute Values for Small x
At x = 1: f(1) = 5(1)³ = 5, g(1) = 3¹ = 3. At x = 5: f(5) = 5(125) = 625, g(5) = 3⁵ = 243. At x = 8: f(8) = 5(512) = 2,560, g(8) = 3⁸ = 6,561.At x = 8, the exponential (6,561) has already surpassed the polynomial (2,560). - 3
Step 3 — Narrow the Crossover
At x = 6: f(6) = 5(216) = 1,080 and g(6) = 3⁶ = 729. The polynomial is still ahead. At x = 7: f(7) = 5(343) = 1,715 and g(7) = 3⁷ = 2,187. The exponential has overtaken the polynomial.The crossover occurs between x = 6 and x = 7. - 4
Step 4 — Verify the Trend Continues
At x = 10: f(10) = 5(1,000) = 5,000 and g(10) = 3¹⁰ = 59,049. At x = 15: f(15) = 5(3,375) = 16,875 and g(15) = 3¹⁵ = 14,348,907. The gap grows enormously. Once the exponential passes the polynomial, it never falls behind again.3ˣ permanently exceeds 5x³ for all x ≥ 7. - 5
Step 5 — Interpret the Result
Even though the polynomial had a head start (it was larger for x = 1 through 6), the exponential's constant multiplication factor of 3 eventually overwhelmed the cubic's additive growth. This confirms CCSS.F-LE.3: the exponential always wins in the long run.
SECTION 7
Strengths & Limitations of Each Growth Model
Each function type is useful for modeling different real-world situations. The key is understanding which model fits the scenario and recognizing that no polynomial model is appropriate for truly exponential phenomena over the long term.
| Function Type | Best Used When… | Limitations |
|---|---|---|
| Linear (mx + b) | A quantity increases or decreases at a constant rate—hourly wages, distance at constant speed, simple depreciation. | Cannot model accelerating or decelerating growth. Oversimplifies many real phenomena over long time spans. |
| Quadratic (ax² + bx + c) | Projectile motion, area calculations, situations where the rate of change itself changes at a constant rate. | Eventually dominated by exponentials; parabolas can turn downward, which may not match the scenario. |
| Polynomial (aₙxⁿ + …) | Complex curves, approximations of short-term trends, engineering design curves, volume formulas. | Higher degree ≠ faster than exponential; all polynomials are eventually surpassed. Harder to interpret as degree increases. |
| Exponential (a · bˣ) | Population growth, compound interest, radioactive decay, viral spread, Moore's Law—any scenario with a constant percentage change. | Unrealistic for unlimited time—real systems face constraints (resources, space). Often transitions to logistic growth. |
When to use each growth model
KEY TAKEAWAY
SECTION 8
Connections to Advanced Theory
The idea that exponential functions eventually dominate polynomials is just the beginning of a hierarchy of growth rates studied in higher mathematics and computer science. Understanding this hierarchy prepares you for more advanced coursework.
| Concept in This Lesson | Advanced Extension |
|---|---|
| Exponential eventually exceeds any polynomial | In calculus, this is proven rigorously using limits: lim(x→∞) xⁿ / bˣ = 0 for any n and any b > 1. |
| Comparing growth rates using tables | In computer science, Big-O notation classifies algorithms by growth rate: O(n), O(n²), O(2ⁿ). Exponential algorithms are considered impractical for large inputs. |
| Constant ratio characterizes exponential functions | Differential equations formalize this: if dy/dx = ky, then y = Ceᵏˣ. The rate of change being proportional to the function's value is the hallmark of exponential behavior. |
| Real-world exponential growth (populations, interest) | Logistic growth models (studied in AP courses) show that exponential growth transitions to a bounded curve when resources are limited: y = L / (1 + e⁻ᵏ⁽ˣ⁻ˣ⁰⁾). |
From Algebra 2 to calculus and computer science
There is even a growth family faster than exponentials: factorials (n!). Just as exponentials dominate polynomials, factorials dominate exponentials. The growth-rate hierarchy goes: logarithmic < polynomial < exponential < factorial. Mastering the polynomial-versus-exponential comparison in this lesson gives you the foundational reasoning you'll need for all of these more advanced ideas.
SECTION 9
Practice Problems
Question 1: CONCEPTUAL
Show answer
Question 2: BASIC CALCULATION
Show answer
Question 3: INTERMEDIATE
Show answer
Question 4: APPLIED
Show answer
Question 5: CRITICAL THINKING
Show answer
SUMMARY
Lesson Summary
Summary
This lesson explored the central claim of CCSS.F-LE.3: a quantity increasing exponentially will eventually exceed a quantity increasing linearly, quadratically, or as any polynomial function. The fundamental reason is that polynomial functions grow through repeated addition (their output ratios shrink toward 1), while exponential functions grow through repeated multiplication (their output ratio stays constant and greater than 1).
Using graphs, you saw the exponential curve start slowly and then rocket past all polynomial curves. Using tables, you confirmed that exponential outputs eventually dwarf polynomial outputs by orders of magnitude. You also learned to distinguish growth types by examining constant differences (linear), constant second differences (quadratic), and constant ratios (exponential). This concept connects forward to limits in calculus, Big-O notation in computer science, and real-world modeling of populations, finance, and technology.