
Section 1
Where Did This Idea Come From?
Humans have always wanted to describe how quickly things change. Whether ancient astronomers tracked planets sliding across the night sky or merchants calculated how fast profits grew, the idea of comparing a change in output to a change in input has been around for thousands of years. The average rate of change is the formal algebraic version of that same everyday question: "How much did something change, and over what interval did it happen?"
~300 BCE • Ancient Greece
1300s–1400s • Medieval Scholars
1600s • Galileo & Descartes
Late 1600s • Newton & Leibniz
Today • Algebra 1 & Beyond
The big question this concept addresses is simple but powerful: if a function changes between two input values, how fast does it change on average across that interval? The formula gives you a single number that captures the overall trend — even if the function wiggles along the way.
Section 2
Core Principles & Definitions
Before you calculate anything, you need to understand four foundational ideas. Each one builds on your existing knowledge of functions and coordinate graphs.
Rate of Change = Slope
Two Points Define the Interval
It Describes the "Big Picture"
Units Tell the Story
✦ Key Takeaway
Section 3
Seeing It on a Graph
A picture makes this concept click. Below is a graph of a function f(x) with a curved shape. The two highlighted points sit on the curve at x = 1 and x = 5. The straight dashed line connecting them is called a secant line. The slope of that secant line is the average rate of change over the interval [1, 5].
Notice a few things in the diagram. The curved function rises steeply in some places and flattens in others, but the secant line draws a straight path from the starting point (1, 2) to the ending point (5, 10). The vertical change (Δy = 8) divided by the horizontal change (Δx = 4) gives the average rate of change: 8 ÷ 4 = 2. That means, on average, the function's output increased by 2 units for every 1 unit increase in x across that interval.
Section 4
The Formula & How to Use It
The average rate of change of a function f over the interval from x = a to x = b is calculated with a formula you already know in disguise — it's the slope formula, just written in function notation.
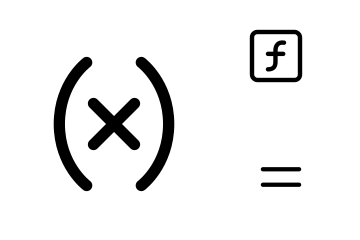
Average Rate of Change Formula
f(b) = function output at the end of the interval | f(a) = output at the start | b − a = length of the interval
If you've seen the slope formula m = (y₂ − y₁) / (x₂ − x₁), this is the same idea. Replace y₂ with f(b), replace y₁ with f(a), and the x-values become b and a. The numerator is the total change in the output (sometimes written Δy or Δf), and the denominator is the total change in the input (Δx).
Slope Notation (Equivalent)
This is the same calculation — just different notation.
Here's the step-by-step process to find the average rate of change every time:
Step-by-Step Method
a (start) and b (end).- Step 1 — Identify the interval. You need two x-values:
a(start) andb(end). - Step 2 — Find the function's output at each endpoint. If given a formula, plug in
aandb. If given a table, look up the y-values. - Step 3 — Subtract the outputs:
f(b) − f(a). This is the change in y. - Step 4 — Subtract the inputs:
b − a. This is the change in x. - Step 5 — Divide:
(f(b) − f(a)) / (b − a). This quotient is the average rate of change. - Step 6 — Interpret. Explain what the number means using the context and units of the problem.
Sign Matters
The sign of the average rate of change tells you whether the function is going up or down (on average) across the interval.
Section 5
Working From a Table vs. a Formula
You'll encounter average rate of change in two main formats: functions given as equations and functions given as tables of values. The process is the same either way, but the way you find f(a) and f(b) differs.
Example With a Table
Suppose you're given the following table and asked to find the average rate of change from x = 1 to x = 4.
| x | f(x) |
|---|---|
| 0 | 5 |
| 1 | 8 |
| 2 | 13 |
| 3 | 20 |
| 4 | 29 |
| 5 | 40 |
From the table, f(1) = 8 and f(4) = 29. So the average rate of change is (29 − 8) / (4 − 1) = 21 / 3 = 7. The output grew by an average of 7 units per 1 unit of x over that interval. Notice that you don't need to worry about what happened at x = 2 or x = 3 — only the endpoints matter.
Example With a Formula
If g(x) = 2x² − 1, find the average rate of change on [1, 3]. First, evaluate: g(1) = 2(1)² − 1 = 1 and g(3) = 2(3)² − 1 = 17. Then divide: (17 − 1) / (3 − 1) = 16 / 2 = 8. The function's output increased at an average rate of 8 units per unit of x.
Section 6
Full Worked Example
Let's work through a real-world problem from start to finish, showing every detail.
Plant Growth — Average Rate of Change
- 1
Problem
A plant's height (in centimeters) is modeled by the functionh(t) = t² + 2t + 5, wheretis the number of weeks after planting. Find and interpret the average rate of change of the plant's height from week 1 to week 4. - 2
Step 1 — Identify the Interval
The interval is from t = 1 to t = 4. So a = 1 and b = 4. - 3
Step 2 — Find the Output at Each Endpoint
Evaluate h(1):h(1) = (1)² + 2(1) + 5 = 1 + 2 + 5 = 8 - 4
Step 2 (continued)
Evaluate h(4):h(4) = (4)² + 2(4) + 5 = 16 + 8 + 5 = 29 - 5
Step 3 — Subtract the Outputs (Numerator)
Calculate the change in output:h(4) − h(1) = 29 − 8 = 21 - 6
Step 4 — Subtract the Inputs (Denominator)
Calculate the change in input:4 − 1 = 3 - 7
Step 5 — Divide
Compute the average rate of change:Average Rate of Change = 21 / 3 = 7 - 8
Step 6 — Interpret
The average rate of change is 7 centimeters per week. This means that between week 1 and week 4, the plant grew an average of 7 cm each week. The plant might have grown faster in some weeks and slower in others, but 7 cm/week captures the overall trend.
Section 7
Strengths, Limitations & Comparisons
Average rate of change is incredibly useful, but it's important to know what it can and can't tell you. Let's compare it with a few related ideas.
| Feature | Average Rate of Change | Actual Rate at a Single Point |
|---|---|---|
| What it measures | Overall change across an interval | Speed of change at one exact moment |
| Data needed | Two points (or two function values) | Requires calculus (derivatives) |
| Graph interpretation | Slope of the secant line | Slope of the tangent line |
| For linear functions | Same everywhere — the constant slope | Same everywhere — identical result |
| For non-linear functions | Depends on which interval you choose | Changes from point to point |
| Accessible in Algebra 1? | Yes ✓ | Not yet — needs calculus |
Strengths: Average rate of change is simple to compute, requires no calculus, and gives a clear summary of how a function behaves across any interval you pick. It works for functions given as formulas, tables, or even graphs (where you read coordinates).
Limitations: It hides what happens inside the interval. A function could rise sharply and then fall, yet the average rate of change might still be positive if the endpoint is higher than the start. Two very different functions could have the same average rate of change over the same interval if they start and end at the same values.
✦ Key Takeaway
Section 8
Connection to Advanced Ideas
If you continue into Pre-Calculus and Calculus, the average rate of change becomes the launching pad for one of the most important concepts in mathematics: the derivative. Here's how the two connect.
When you calculate the average rate of change over the interval [a, b], you're measuring the secant line's slope. Now imagine sliding point b closer and closer to a. The interval shrinks, and the secant line begins to rotate toward the curve. In the limit — when the two points are "infinitely close" — the secant line becomes a tangent line, and its slope is the instantaneous rate of change, also called the derivative. You don't need to master this yet, but it's valuable to know that everything you're learning here leads directly to that powerful idea.
| Concept | Average Rate of Change (Algebra 1) | Derivative (Calculus) |
|---|---|---|
| Formula | [f(b) − f(a)] / (b − a) | lim (h→0) [f(a+h) − f(a)] / h |
| Interval size | Finite (b − a > 0) | Approaches zero |
| Result | One slope for the whole interval | A slope at a single point |
| Graphically | Slope of secant line | Slope of tangent line |
For now, focus on mastering the average rate of change. It builds your fluency with function notation, strengthens your understanding of slope, and gives you a conceptual head start for the mathematics ahead.
Section 9
Practice Problems
Try each problem before revealing the answer. The difficulty increases as you go.
Question 1: Conceptual
Show answer
f(x) = mx + b, where the slope m is constant. Because the function rises (or falls) at the same steady rate everywhere, the ratio of change in y to change in x is always m, regardless of which two x-values you pick. No matter how wide or narrow the interval, the secant line has the same slope as the function itself — they are the same line. This is what makes linear functions special: constant rate of change.Question 2: Basic Calculation
f(x) from x = 2 to x = 6.
| x | f(x) |
|---|------|
| 0 | 3 |
| 2 | 11 |
| 4 | 27 |
| 6 | 51 |
| 8 | 83 |Show answer
f(2) = 11 and f(6) = 51. Apply the formula: Average Rate of Change = (51 − 11) / (6 − 2) = 40 / 4 = 10. The function's output increased by an average of 10 units per unit of x over the interval [2, 6].Question 3: Intermediate
f(x) = −x² + 6x. Find the average rate of change on the interval [1, 5]. Is the result positive or negative, and what does the sign tell you?Show answer
f(1) = −(1)² + 6(1) = −1 + 6 = 5 and f(5) = −(5)² + 6(5) = −25 + 30 = 5. Average Rate of Change = (5 − 5) / (5 − 1) = 0 / 4 = 0. The average rate of change is zero. This means the function's output at x = 5 is the same as at x = 1, so there is no net change over that interval. The function goes up in the middle and comes back down, but the starting and ending heights are equal. A rate of zero does not mean nothing happened — it means the increases and decreases canceled out.Question 4: Applied / Multi-Step
t = 0.5 hours to t = 2 hours. Then explain what this rate means in real-world terms, including units.
| Time t (hours) | Distance d(t) (miles) |
|---|---|
| 0 | 0 |
| 0.5 | 18 |
| 1 | 40 |
| 1.5 | 55 |
| 2 | 78 |
| 2.5 | 78 |Show answer
d(0.5) = 18 miles and d(2) = 78 miles. Average Rate of Change = (78 − 18) / (2 − 0.5) = 60 / 1.5 = 40. The average rate of change is 40 miles per hour. This means that between 0.5 hours and 2 hours after leaving home, the car traveled at an average speed of 40 mph. The car's actual speed at any moment may have been higher or lower, but 40 mph summarizes the overall pace across that 1.5-hour window.Question 5: Challenge / Synthesis
f(x) = x² − 4x + 7, the average rate of change over the interval [2, k] equals 5. Find the value of k. (Hint: set up the average rate of change formula equal to 5 and solve for k.)Show answer
f(2) = (2)² − 4(2) + 7 = 4 − 8 + 7 = 3. Next, find f(k) in terms of k: f(k) = k² − 4k + 7. Set up the average rate of change equal to 5: [f(k) − f(2)] / (k − 2) = 5 → [(k² − 4k + 7) − 3] / (k − 2) = 5 → (k² − 4k + 4) / (k − 2) = 5. Notice the numerator factors: k² − 4k + 4 = (k − 2)². So: (k − 2)² / (k − 2) = k − 2 = 5. Therefore k = 7. Check: f(7) = 49 − 28 + 7 = 28. Average rate of change = (28 − 3) / (7 − 2) = 25 / 5 = 5 ✓. This problem shows how average rate of change connects algebra skills like factoring to function analysis — a great preview of ideas you'll see in Algebra 2 and beyond.Summary
Putting It All Together
Summary
The average rate of change of a function measures how quickly the output changes, on average, across a specified interval. It is calculated with the formula [f(b) − f(a)] / (b − a), which is identical to the slope of the secant line connecting the two corresponding points on the graph. A positive result means the function's output increased overall; a negative result means it decreased; and a result of zero means the output ended where it started, even if it changed in the middle.
You can apply this formula whether the function is given as an equation (plug in the endpoints) or as a table (read off the values directly). Always finish by interpreting your answer in context, including units. This concept is the algebraic foundation for the derivative in calculus, making it one of the most important ideas in your math education so far.